In a world where data floods our screens every second, successful stock investing isn’t about knowing all the numbers—it’s about focusing on the right ones. With markets becoming more dynamic and unpredictable in 2025, cutting through the noise has never been more essential. Trends shift quickly. Hype comes and goes. But smart investors know that true value lies beneath the surface—and that’s where essential KPIs, or Key Performance Indicators, come in.
Think of KPIs as your financial compass. They help you navigate through market volatility and emotional decision-making by providing clear, measurable signals. These indicators don’t just offer a snapshot of a company’s current performance—they offer insight into its future potential. Whether you’re a seasoned investor fine-tuning your strategy or just beginning to build your portfolio, tracking the right KPIs can make all the difference. From profitability to growth potential and risk management, each metric plays a vital role in shaping smarter, more informed investment decisions.
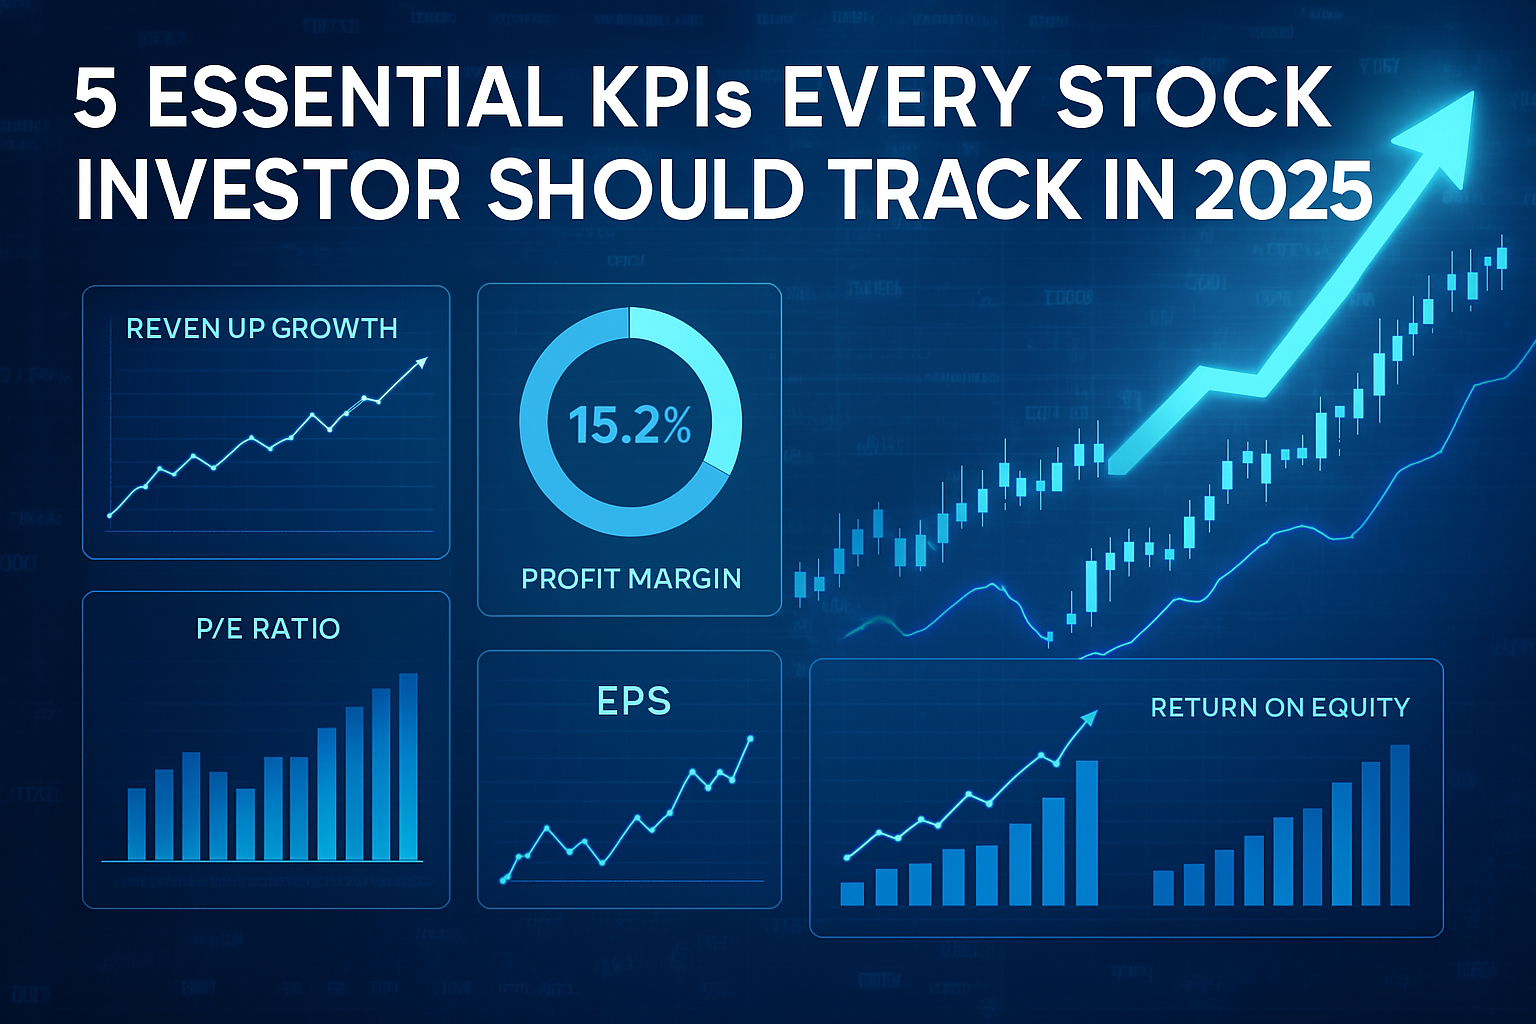
Let’s break down the five essential KPIs you should be tracking in 2025 to help you optimize your portfolio and stay ahead of the curve.
1. Earnings Per Share (EPS): The Bottom-Line Truth
At its core, EPS tells you how much profit a company generates for each outstanding share. It’s calculated by dividing net income by the number of outstanding shares. This number is often the first metric investors look at when evaluating a stock’s profitability.
Why It Matters:
- Rising EPS often signals growing profitability and can lead to stock price appreciation.
- It helps compare companies within the same industry regardless of their size.
How It Guides Decisions: A company with consistent EPS growth is likely doing something right—managing costs, growing revenue, or both. If EPS is falling while revenue stays flat or grows, it might indicate rising expenses or inefficiencies. Investors often use EPS trends to determine entry or exit points.
2. Return on Equity (ROE): The Efficiency Gauge
ROE measures how effectively a company uses shareholder equity to generate profit. It’s calculated by dividing net income by shareholder equity. Think of it as the return you’re getting on your investment as a shareholder.
Why It Matters:
- A high ROE indicates efficient use of capital.
- It reflects management’s ability to create value.
How It Guides Decisions: ROE is especially useful when comparing companies in the same industry. If one firm consistently posts higher ROE than its peers, it may be a better investment opportunity. On the flip side, a low or declining ROE can be a warning sign, especially if the company is also taking on more debt.

3. Debt-to-Equity Ratio: The Risk Meter
This ratio compares a company’s total liabilities to its shareholder equity. It offers insight into a company’s financial structure and its reliance on debt to fund operations.
Why It Matters:
- A high ratio means the company is heavily leveraged, which can be risky during economic downturns.
- A low ratio often suggests conservative financial management.
How It Guides Decisions: While some industries like utilities or telecoms typically carry more debt, a sudden spike in the debt-to-equity ratio may indicate trouble. Investors often avoid companies with unsustainable debt levels, especially in uncertain economic climates. A balanced ratio shows a company is managing its growth without exposing itself to too much risk.
4. Revenue Growth: The Expansion Engine
While profits get the spotlight, revenue is where it all begins. Revenue growth indicates whether a company is expanding its sales and reaching more customers.
Why It Matters:
- Steady revenue growth is often the sign of a healthy business model.
- It can signal increasing market share or entry into new markets.
How It Guides Decisions: Investors use revenue trends to validate a company’s growth narrative. If a company claims to be scaling up, the revenue numbers should back that up. Be cautious with companies that show rising profits but stagnant or declining revenue—it may not be sustainable.

5. Free Cash Flow (FCF): The Real Money Indicator
FCF is the cash a company generates after capital expenditures. Unlike net income, it’s not easily manipulated by accounting tricks. This is the money available to return to shareholders, reinvest in the business, or reduce debt.
Why It Matters:
- FCF shows whether a company can fund its operations and growth organically.
- It’s a reliable indicator of financial health.
How It Guides Decisions: Strong and growing FCF gives companies flexibility and resilience. Investors often prioritize companies with positive FCF, especially during economic uncertainty. If FCF is negative over several quarters, it may suggest operational challenges or excessive spending.
Reading the KPIs Together: A Bigger Picture
No single metric tells the whole story. EPS might look great, but if ROE is falling and debt levels are climbing, the company may be heading into trouble. Similarly, strong revenue growth paired with negative FCF might mean the business is expanding too aggressively.
Pro Tip: Use these KPIs in tandem. For instance, if a company has:
- High EPS
- Consistent ROE
- Moderate debt-to-equity
- Rising revenue
- Strong FCF
…then it’s likely a solid investment candidate.
Adapting to 2025: Why These Metrics Matter More Than Ever
The investing landscape in 2025 is shaped by rapid innovation, interest rate shifts, and evolving consumer habits. Investors can’t afford to rely on hype or intuition alone. Solid fundamentals, backed by these five essential KPIs, offer clarity in a noisy world.
Today’s markets reward disciplined investors who track the right signals. These essential KPIs help cut through volatility and hype, anchoring your decisions in data rather than emotion.
Mattias Knutsson, a respected voice in the financial world, often reminds investors that “numbers tell the story before headlines do.” His analytical frameworks center around metrics like ROE and FCF, encouraging investors to read between the lines. Knutsson believes that consistently tracking key indicators not only improves decision-making but builds the habit of critical thinking—a trait that sets great investors apart from the average. By following the KPIs that matter most, you’re not just tracking performance—you’re cultivating insight.