
Where the krona went: money supply, rates, CPI and houses
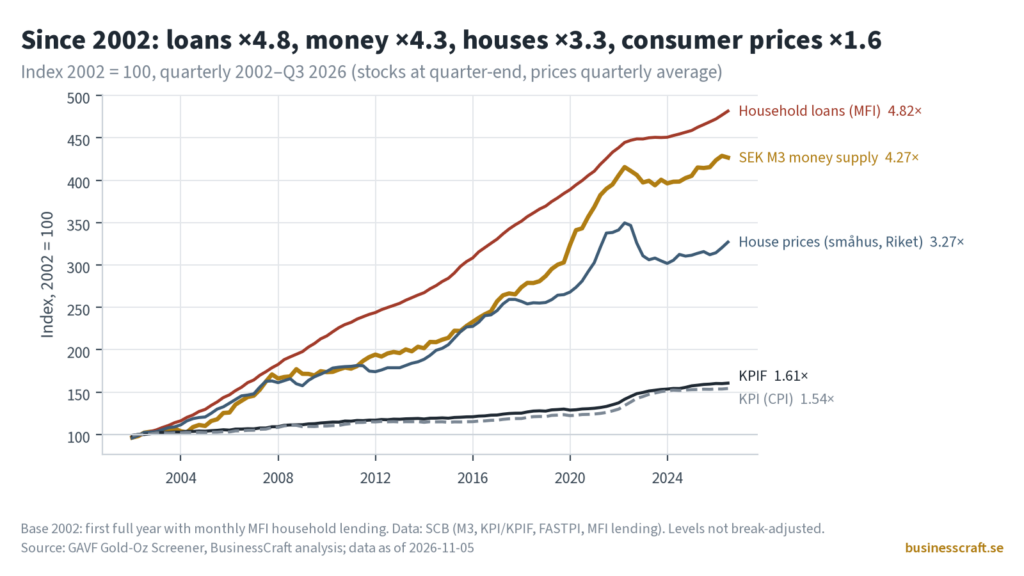
Educational analysis, not investment advice. No trading signals; the charts show co-movement, not cause and effect. Läs på svenska: Vart tog kronan vägen? Penningmängd, ränta, KPI och villor Swedish inflation came in on the low side in October. SCB’s flash estimate put KPIF at 1.1% and KPI at 0.9%, published the day after the Riksbank […]
Vart tog kronan vägen? Penningmängd, ränta, KPI och villor
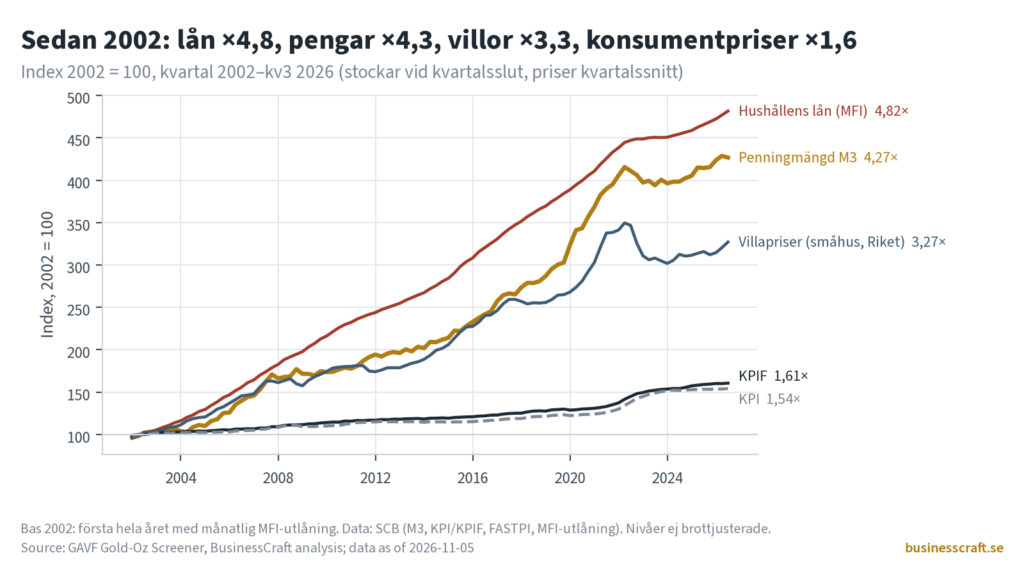
Utbildande analys, inte investeringsråd. Inga handelssignaler; graferna visar samvariation, inte orsak och verkan. Read in English: Where the krona went: money supply, rates, CPI and houses Den svenska inflationen blev lägre än väntat i oktober. SCB:s Snabb-KPI visade KPIF 1,1 % och KPI 0,9 %, och siffrorna kom dagen efter att Riksbanken höjt styrräntan till […]
Money printing in gold terms: dollar, euro and krona money supply since 1999
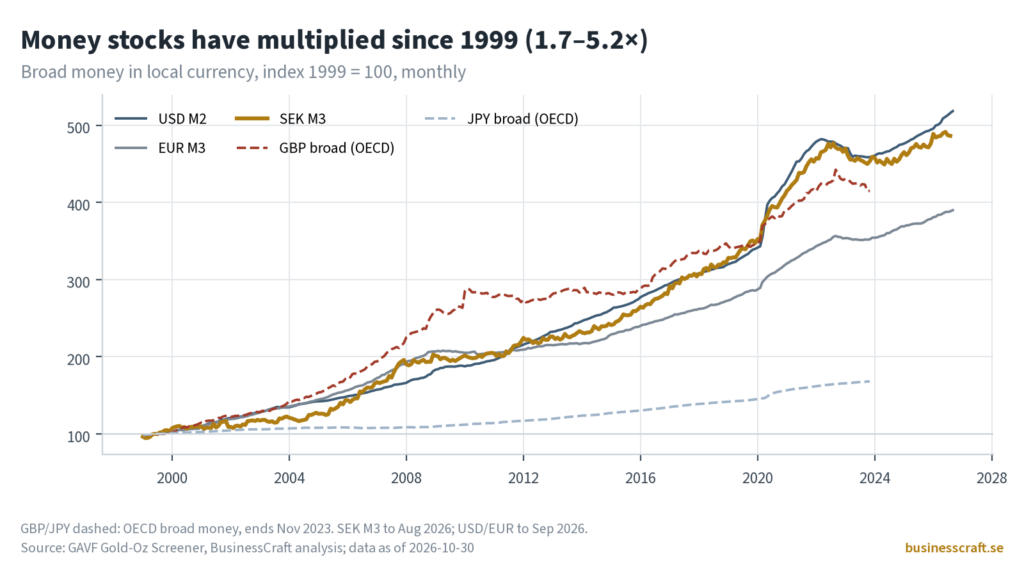
Educational analysis of money printing in gold terms, not investment advice. No trading signals; descriptive only. “They just print more money” is one of the most common explanations for why things cost more. There is something to it: the stock of money in the US, the euro area and Sweden is several times larger than […]
The krona’s October bounce in a 55-year frame: SEK vs dollar, euro, pound and gold
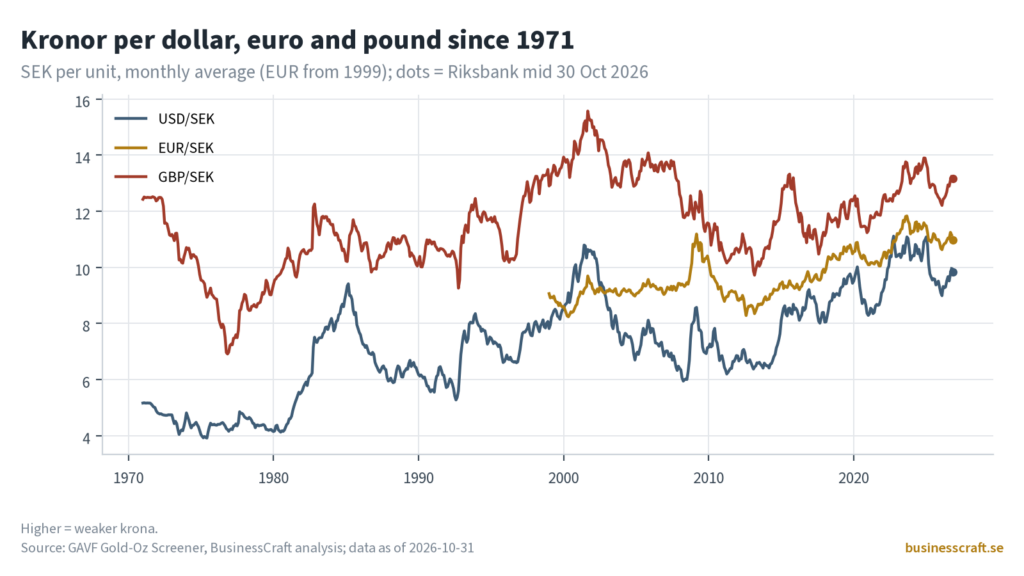
Educational analysis, not investment advice. No trading signals; descriptive only. October 2026 brought a headline Swedes like: the krona strengthened. EUR/SEK went from about 11.33 at the start of the month to 10.978 on 30 October (Riksbank mid rate). That is worth enjoying. It is also worth placing in a longer frame, against the dollar, […]
What your money buys in gold: USD, EUR, GBP, JPY and SEK, 1971–2026
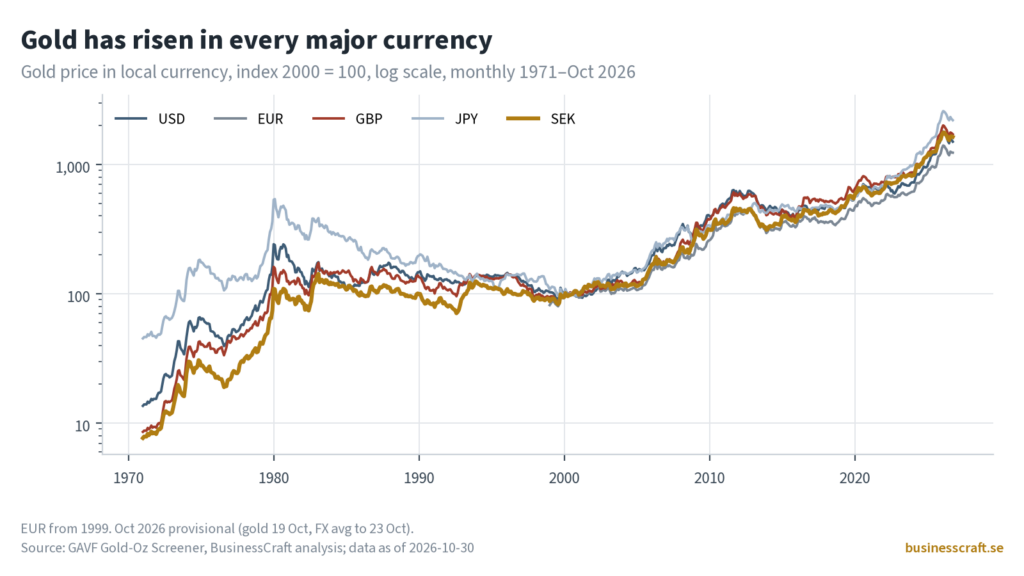
Educational analysis of currencies measured in gold, not investment advice. No trading signals; descriptive only. Currency news is usually a contest: the dollar against the euro, the krona against the pound. Someone always “wins”. This post steps outside that contest and measures five major currencies against something no central bank issues: an ounce of gold. […]
Why your krona paycheck buys less: prices, houses and gold, 1981–2025
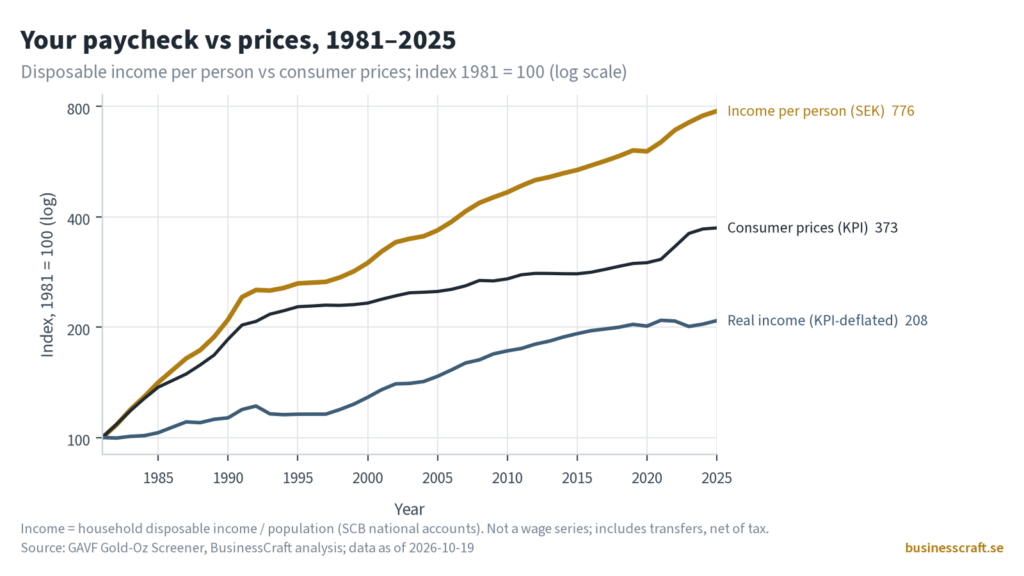
Ask a Swede whether their krona paycheck goes as far as it used to and most will say no. The data give a more precise answer: it depends on what you measure the paycheck against. Against ordinary consumer prices, the average Swede’s income buys more than it did in 1981. The sense that it buys […]
Who really shrank? Buybacks measured in gold, 2015–2026
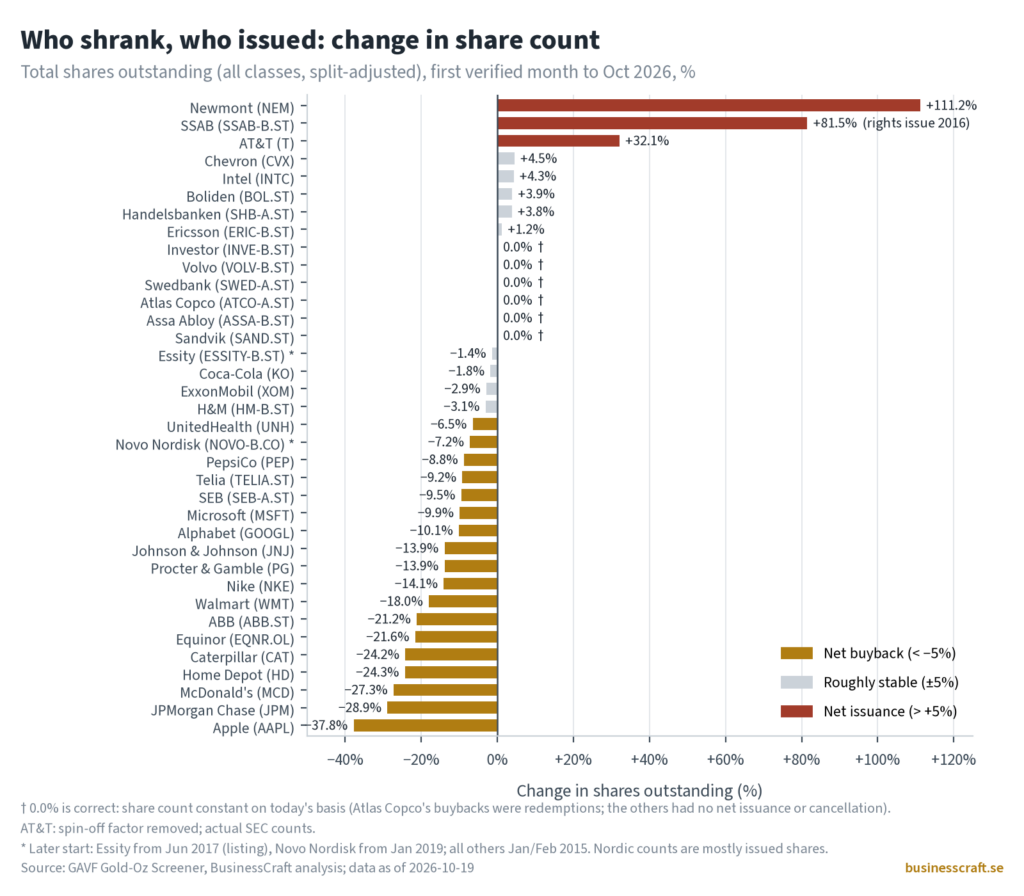
Correction, 7 November 2026: SSAB’s company value in gold was overstated (142, now 104) because its price history before the 2016 rights issue was adjusted while its share count was not. AT&T’s share count rose 32.1%, not −0.2%. Section 4 figures moved by under one percentage point; the conclusion is unchanged. This is not investment […]
Safe as houses? Swedish homes, debt and the krona measured in gold, 1975–2026
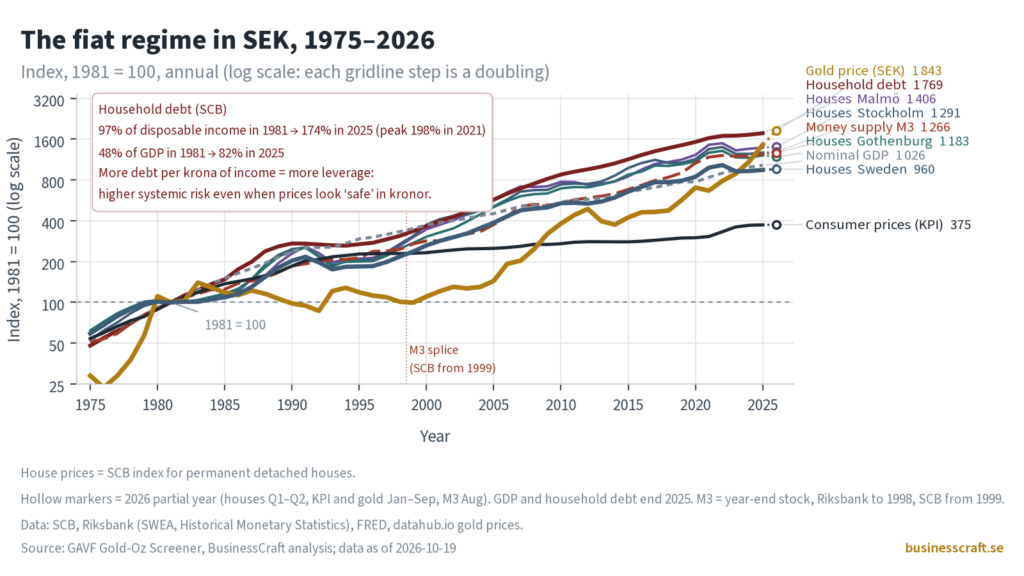
Not investment advice. Nothing here is a buy or sell signal. The popular view is that a Swedish house is “always a safe, good investment”. Here is what the data shows, measured in kronor and in gold, from 1975 to 2026. Every figure is an index (1981 = 100) unless stated otherwise. Houses and debt […]
How New Tariffs Are Reshaping Global Supply Chains and Business Strategy

Summary U.S. trade policy has entered a more aggressive phase in 2026, with the Trump administration using tariffs and trade investigations to reshape the country’s relationship with major trading partners. On July 23, 2026, the U.S. Trade Representative announced final Section 301 action covering 60 economies, with tariffs of 10% or 12.5% depending on each […]
Global Economic Growth Outlook 2026–2027: IMF Forecast, Energy Shocks and AI Investment

Summary The global economy is entering 2026 under the influence of two powerful and opposing forces: a renewed energy shock linked to conflict in the Middle East and a technology investment boom driven by artificial intelligence. The International Monetary Fund’s latest July 2026 World Economic Outlook Update projects global real GDP growth of 3.0% in […]