Educational analysis of currencies measured in gold, not investment advice. No trading signals; descriptive only.
Currency news is usually a contest: the dollar against the euro, the krona against the pound. Someone always “wins”. This post steps outside that contest and measures five major currencies against something no central bank issues: an ounce of gold. Asked that way, the answer is less about who won and more about what they all have in common.
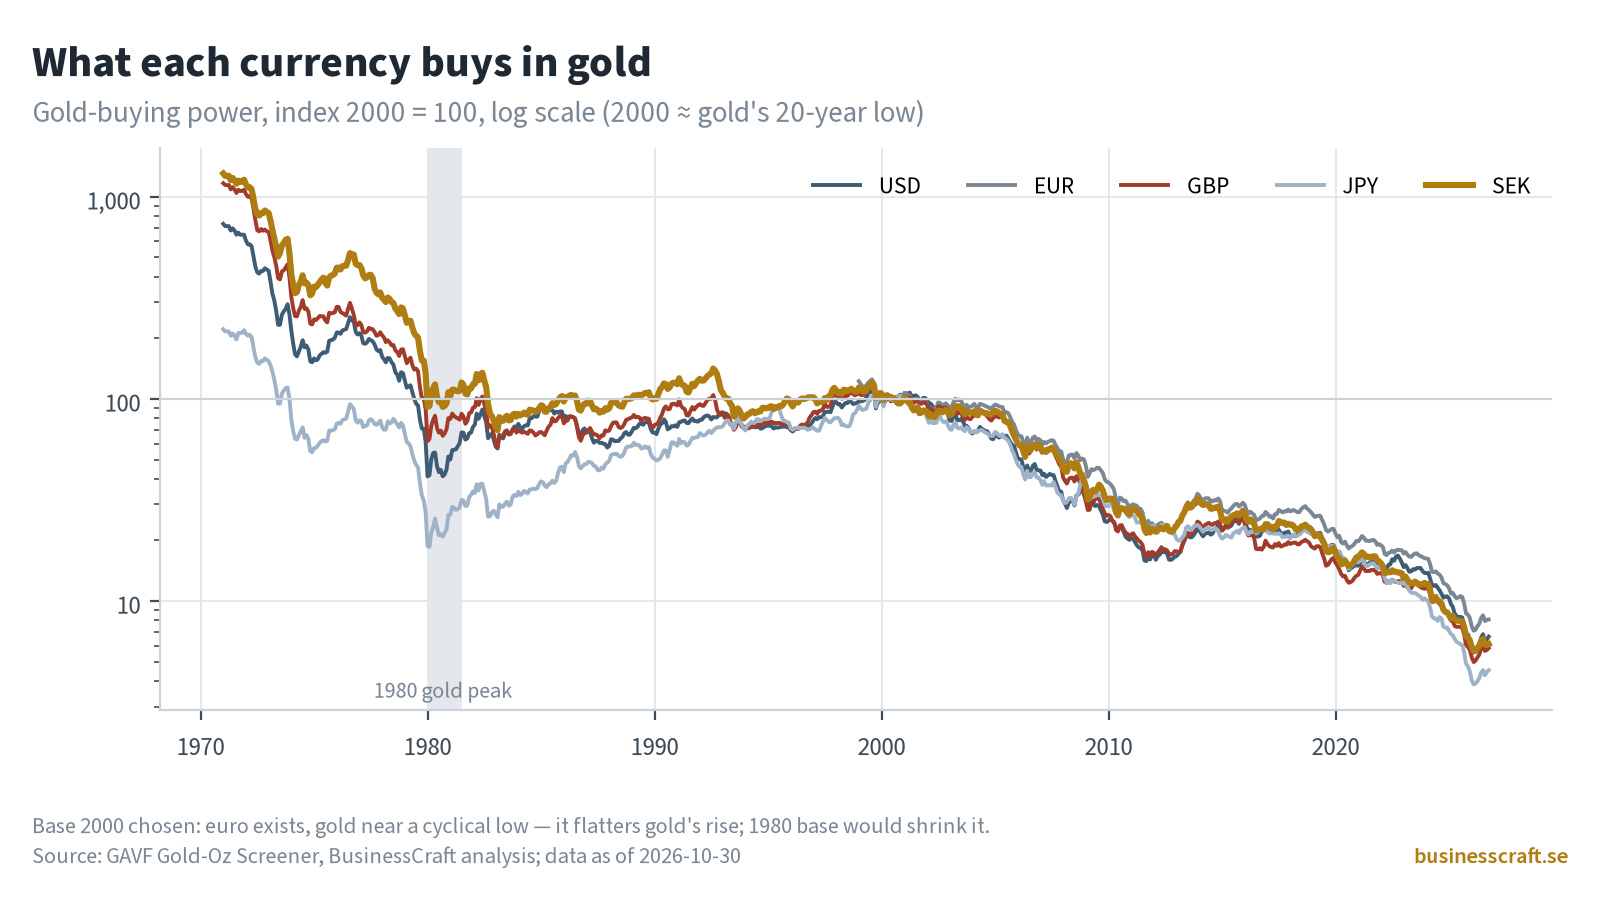
1. Currencies measured in gold: gold in every currency (Chart 1)
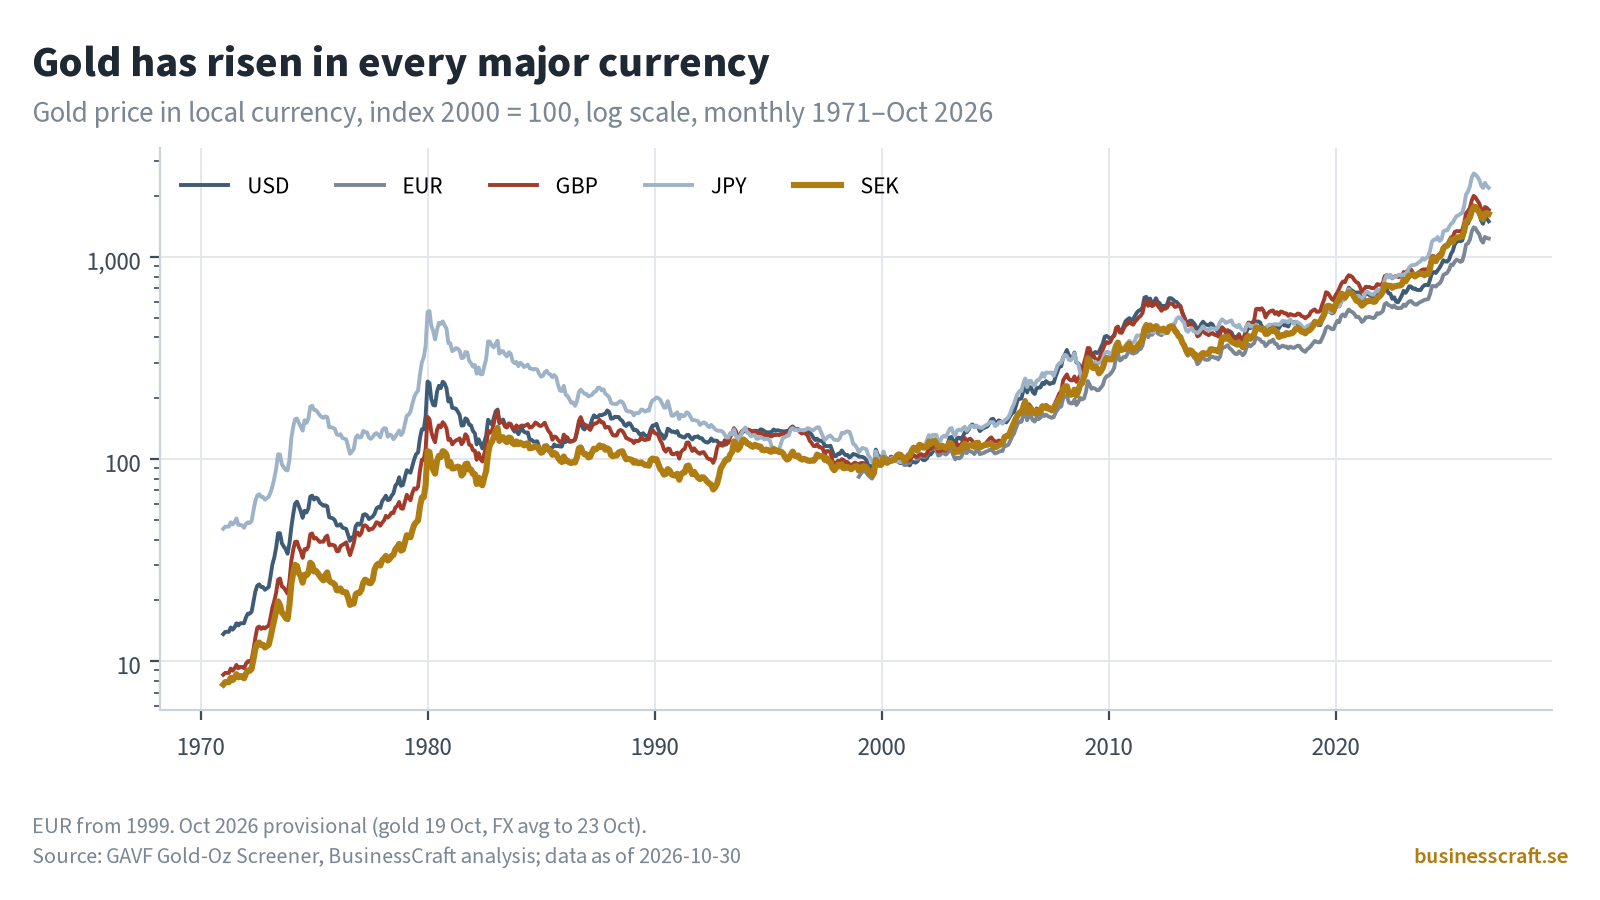
Chart 1 shows the gold price in dollars, euros, pounds, yen and kronor, indexed to 2000 = 100 on a log scale, from 1971 to October 2026. The lines move at different speeds, but they all climb. In October 2026 an ounce cost about 4,188 USD, 3,736 EUR, 3,154 GBP, 661,785 JPY and 41,787 SEK.
2. The shared loss (Charts 2 and 3)
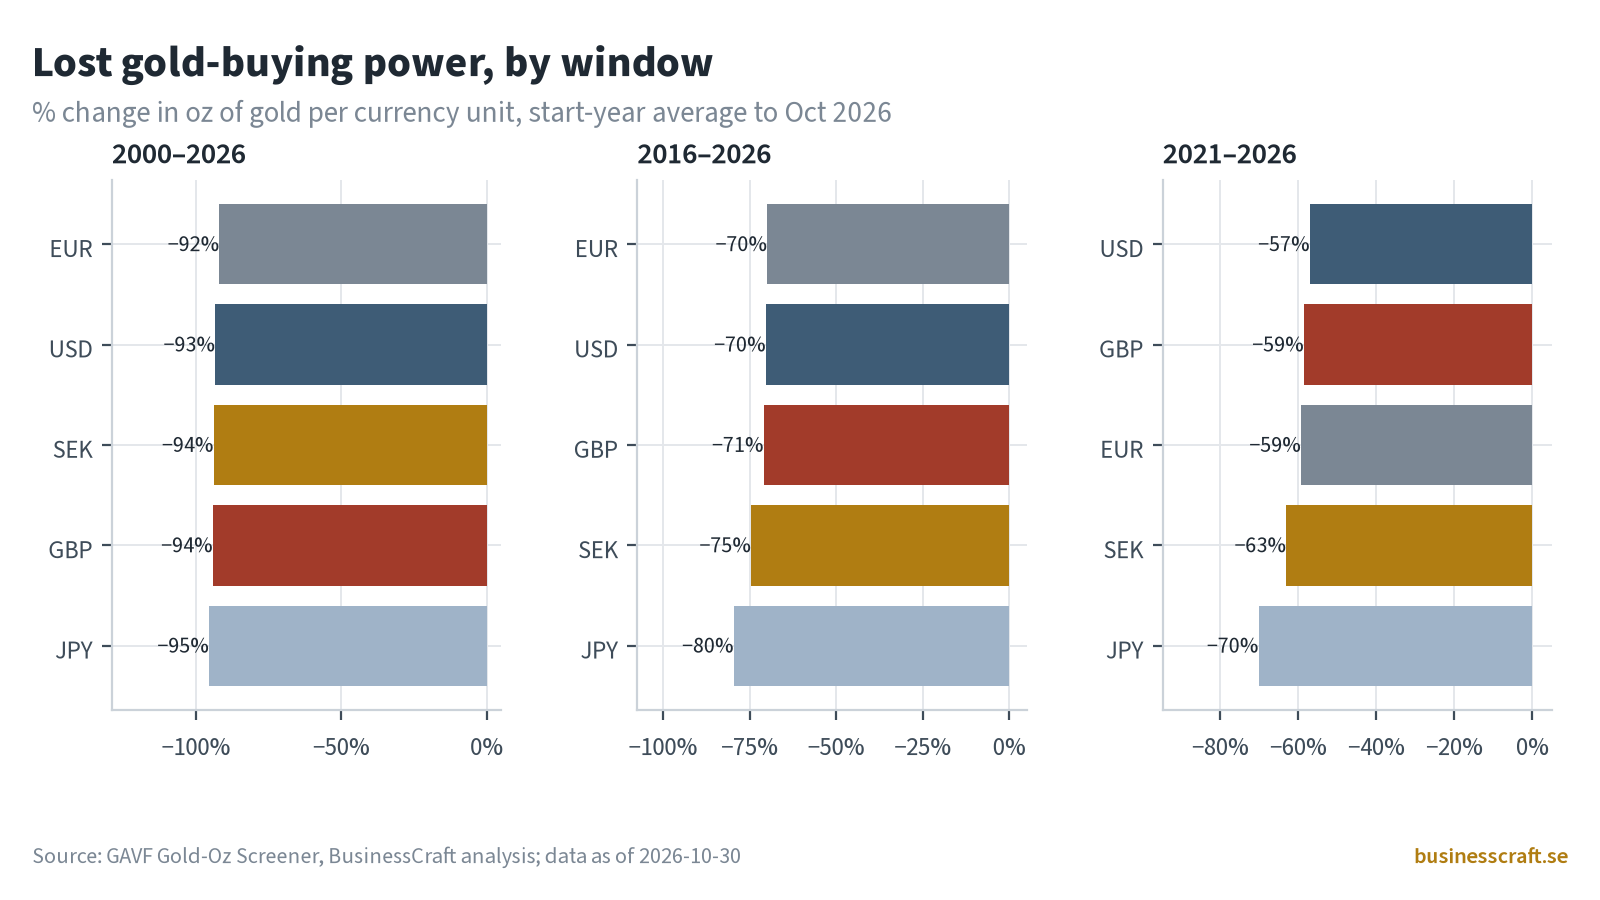
Turn the same data around and you get gold-buying power: how much gold one unit of each currency buys (Chart 2). Since 2000, every one of the five has lost more than nine-tenths:
- EUR −92%
- USD −93%
- SEK −94%
- GBP −94%
- JPY −95%
In krona terms: 100 SEK bought about 0.039 oz of gold on average in 2000 and about 0.0024 oz in October 2026.
Shorter windows tell the same story at a smaller scale (Chart 3). Since 2016 the falls range from about −70% (EUR, USD) to −80% (JPY), with SEK at −75%. Since 2021 the spread widens: USD −57%, GBP −59%, EUR −59%, SEK −63%, JPY −70%.
3. The ranking is mostly noise
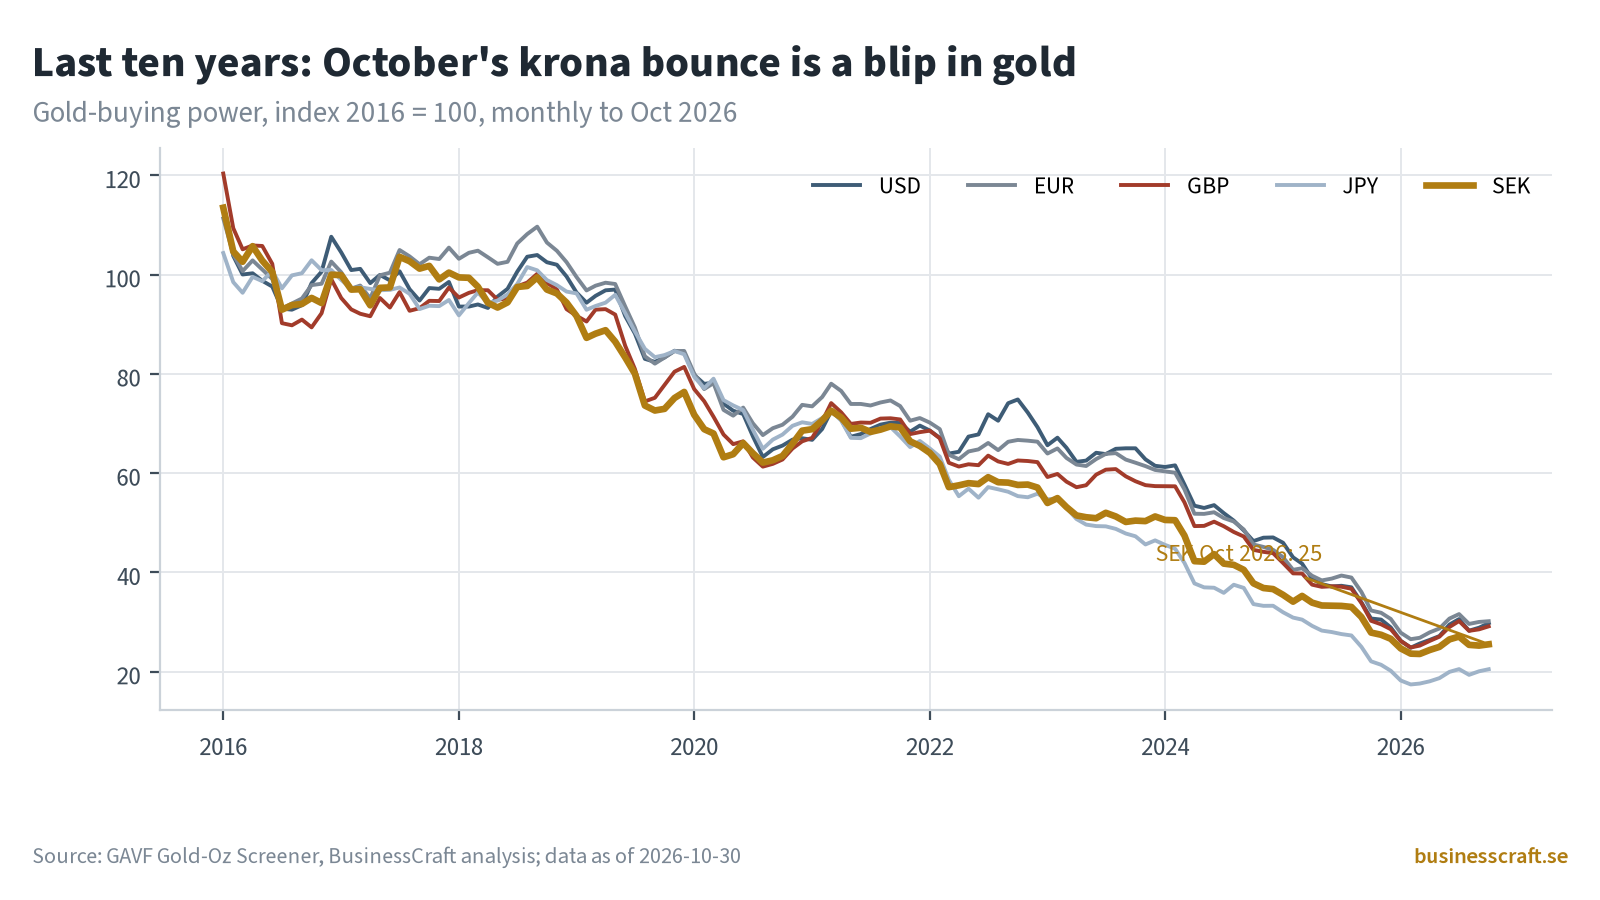
Yes, the euro has held up slightly better than the yen since 2000, and the krona sits mid-table. But the gap between best and worst over 26 years is a few percentage points on a loss of more than 90%. Exchange rates measure fiat currencies against each other; gold measures them against an outside yardstick. Against that yardstick the shared direction dominates the ranking. The ten-year zoom (Chart 4, 2016 = 100) shows the krona’s line in that same downward bundle, with no sign that a good month changes the picture.
4. The base-year caveat
Starting points matter, and 2000 is a flattering one for gold. It sat near the bottom of a two-decade gold bear market, so losses measured from there look large. Chart 2 shades the 1980 gold peak for that reason: measured from 1980, when gold spiked, the fall in gold-buying power is much smaller. The direction since the 2000s is clear; the size of the decline depends on where you start.
Gold also has its own drivers: real interest rates, central-bank buying and risk appetite. “Lost gold-buying power” is therefore not the same as lost purchasing power at the supermarket. Post 05 covers consumer prices, where the picture for Swedish incomes is very different.
Limits and caveats
- The euro exists only from 1999; we do not splice a synthetic ECU/D-mark history before that.
- October 2026 gold is provisional (19 Oct close); October exchange rates are averages to 23 October.
- Base year 2000 sits near a gold low and flatters the losses; this is marked on the charts.
- NOK was fetched but is not charted (data ends September 2026).
- Gold-buying power is not a cost-of-living measure.
Source: BusinessCraft analysis of LBMA gold via datahub.io and FRED exchange rates; data fetched 2026-10-30. Educational analysis, not investment advice. No trading signals. Past data says nothing certain about the future.
Disclaimer: Educational analysis, not investment advice. No trading signals; descriptive only.
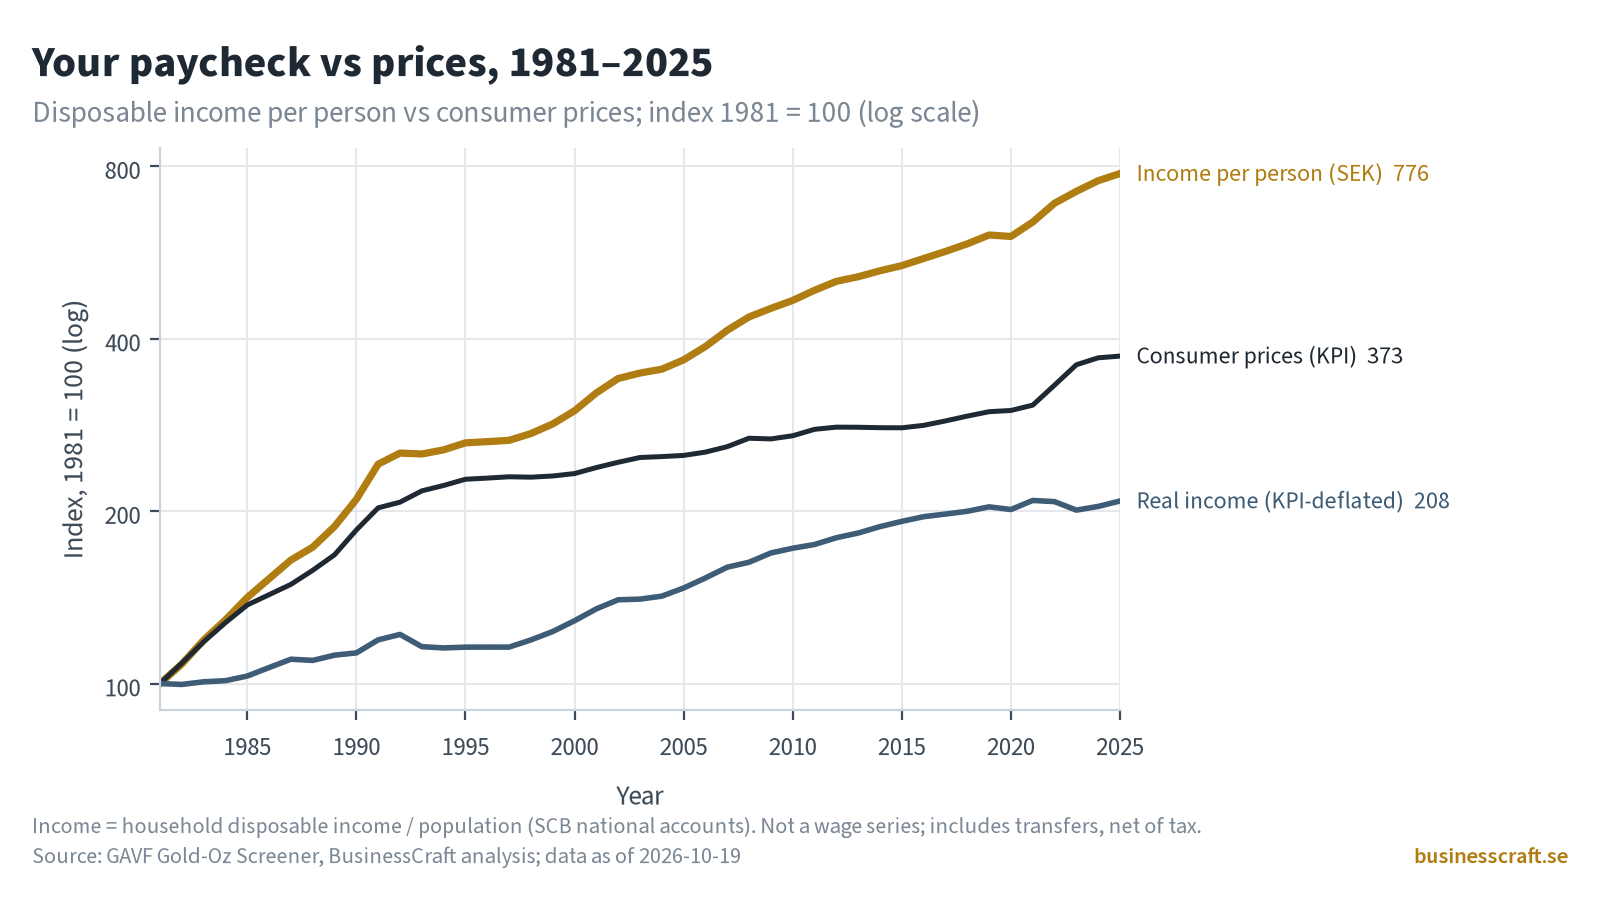
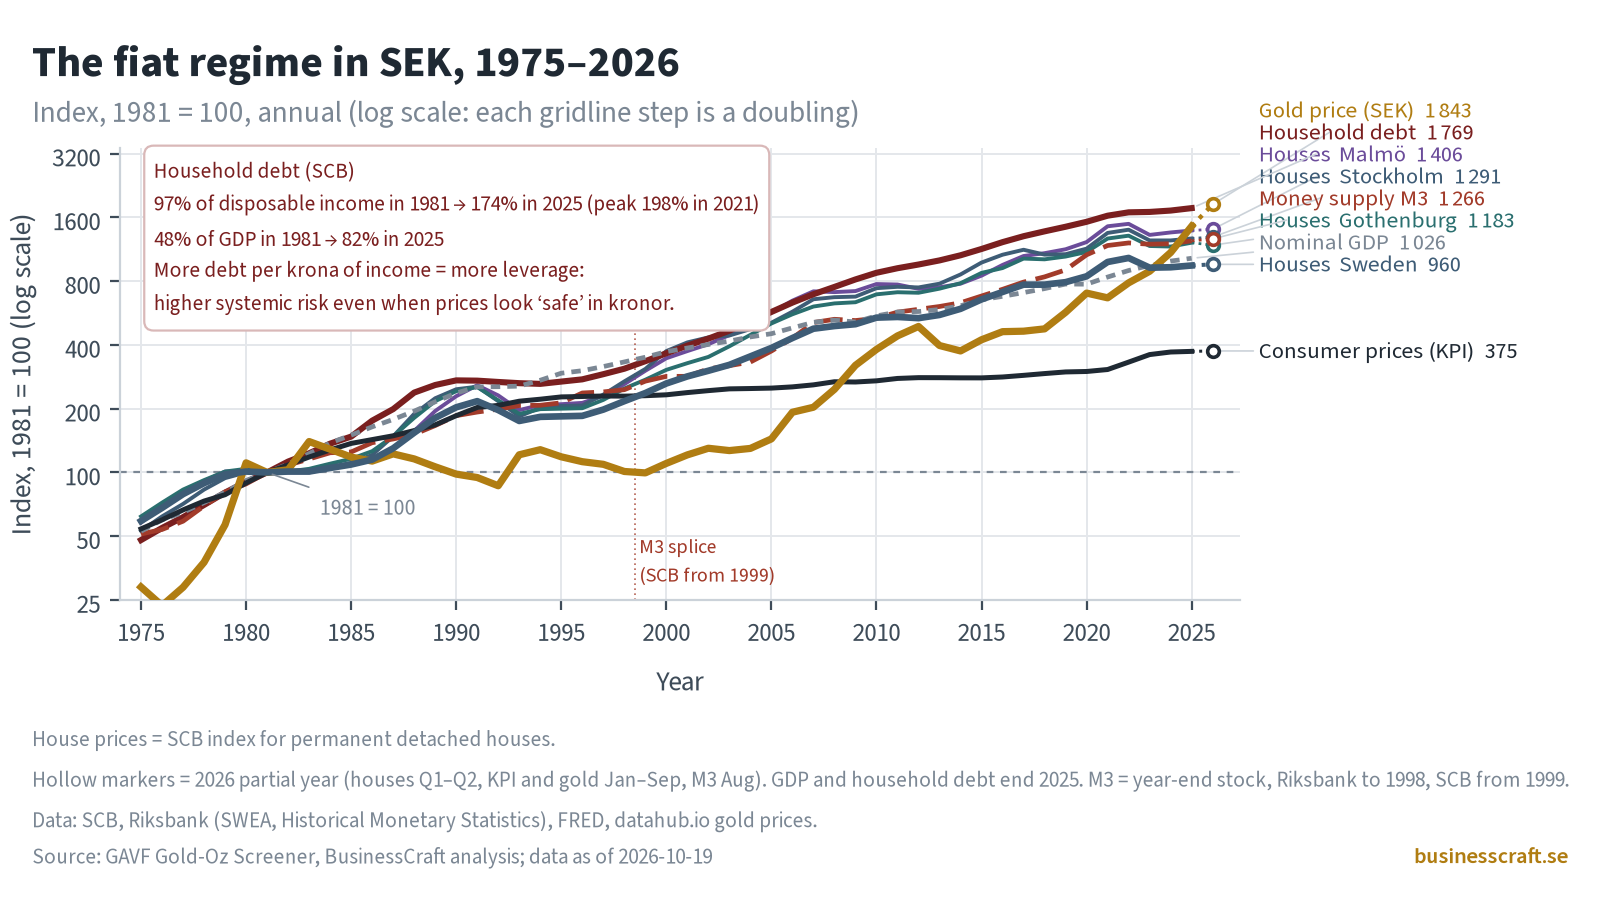
Related reading: why your krona paycheck buys less and Swedish homes and the krona measured in gold. For gold price background, see the LBMA. Currencies measured in gold show a shared loss.