
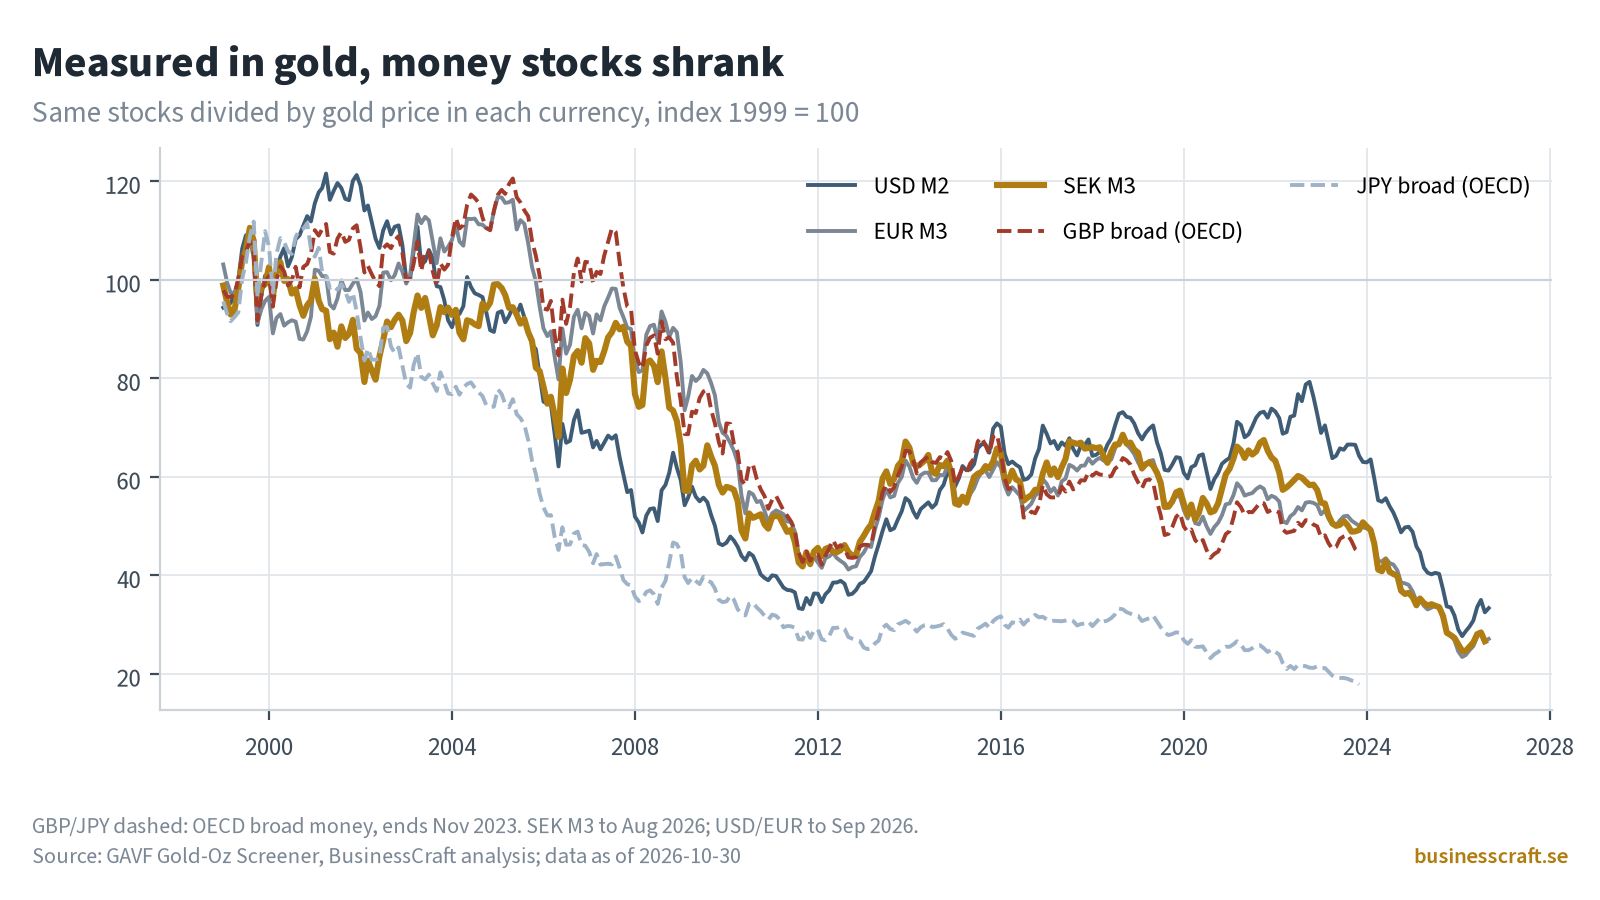
Money supply measured in gold: dollar, euro and krona since 1999
In currency, the money supply has multiplied. In gold, the dollar, euro and krona stocks are now about a third or less of their 1999 size.
Three steps, the same for a currency, the money supply, a house or a company.
Four charts from our published analyses, and a link to a fifth. Each published chart is a fixed snapshot; the label shows how far its data runs. Open the analysis for the full story.
In currency, the money supply has multiplied. In gold, the dollar, euro and krona stocks are now about a third or less of their 1999 size.
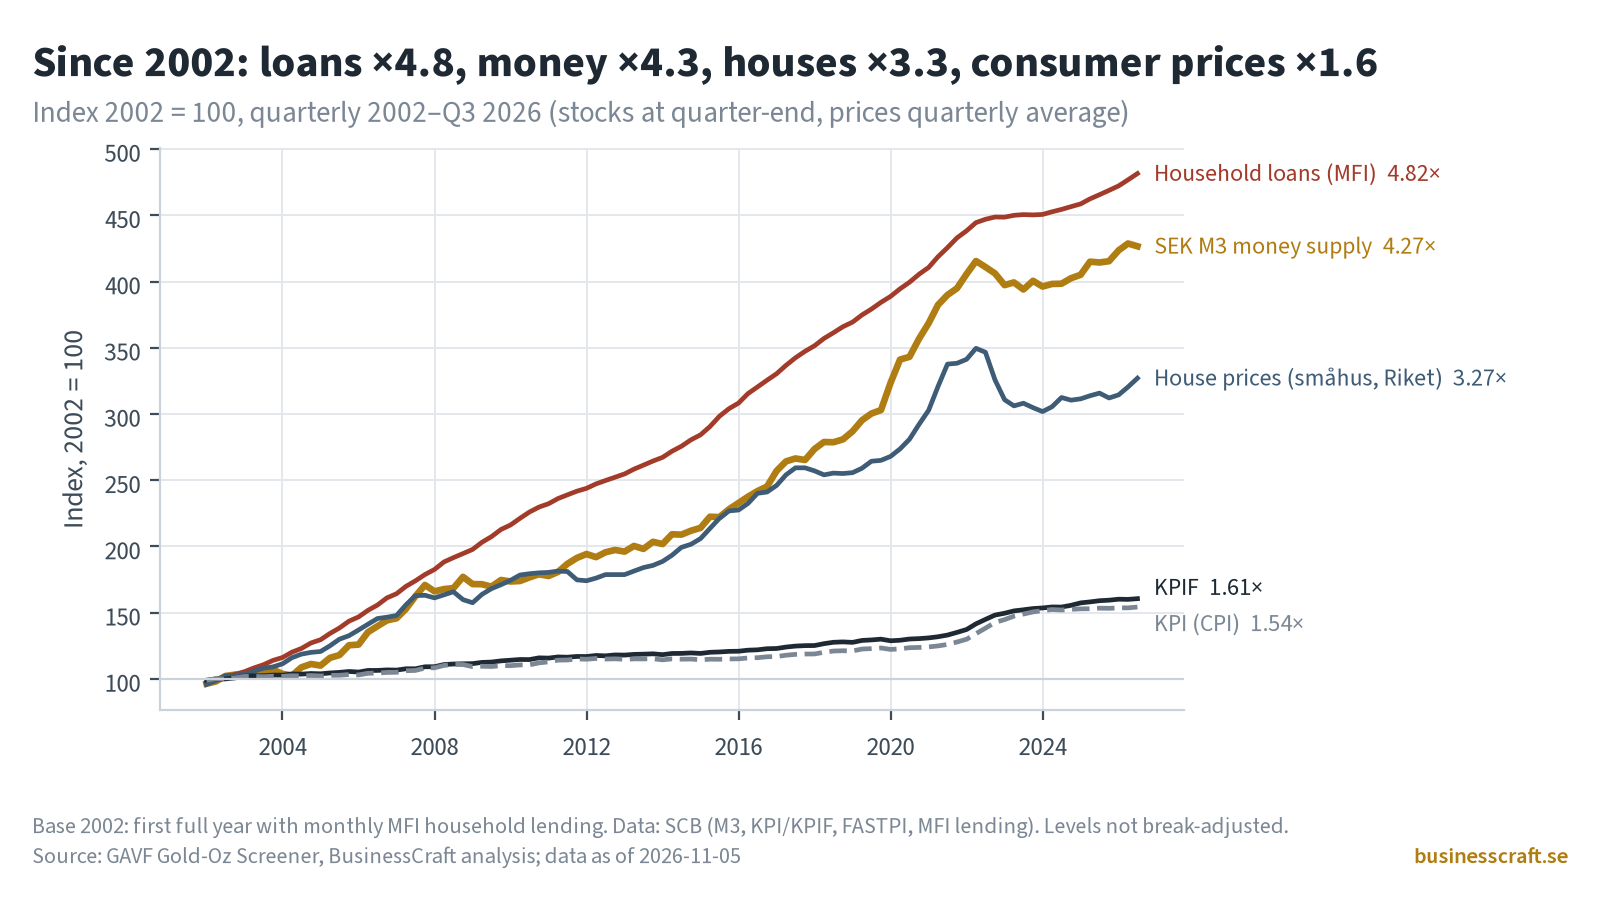
Loans, money and house prices grew three to five times since 2002. Consumer prices grew far less.
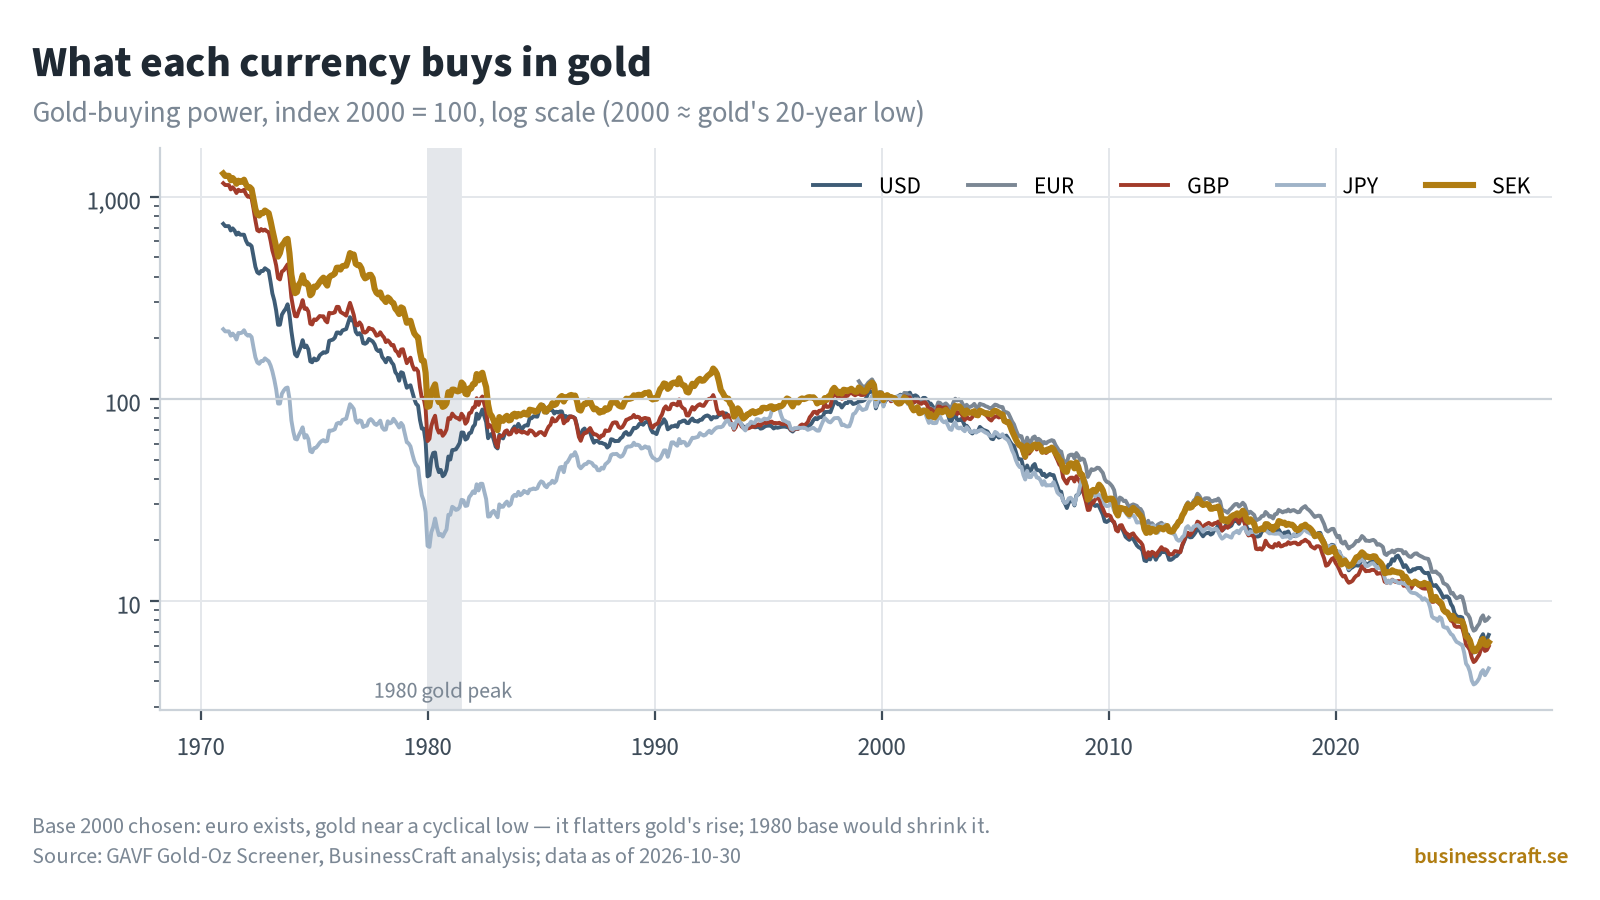
Dollar, euro, pound, yen and krona all buy about 92–95% less gold than in 2000.
See whether buybacks or new share issues have changed what each share is worth in gold.
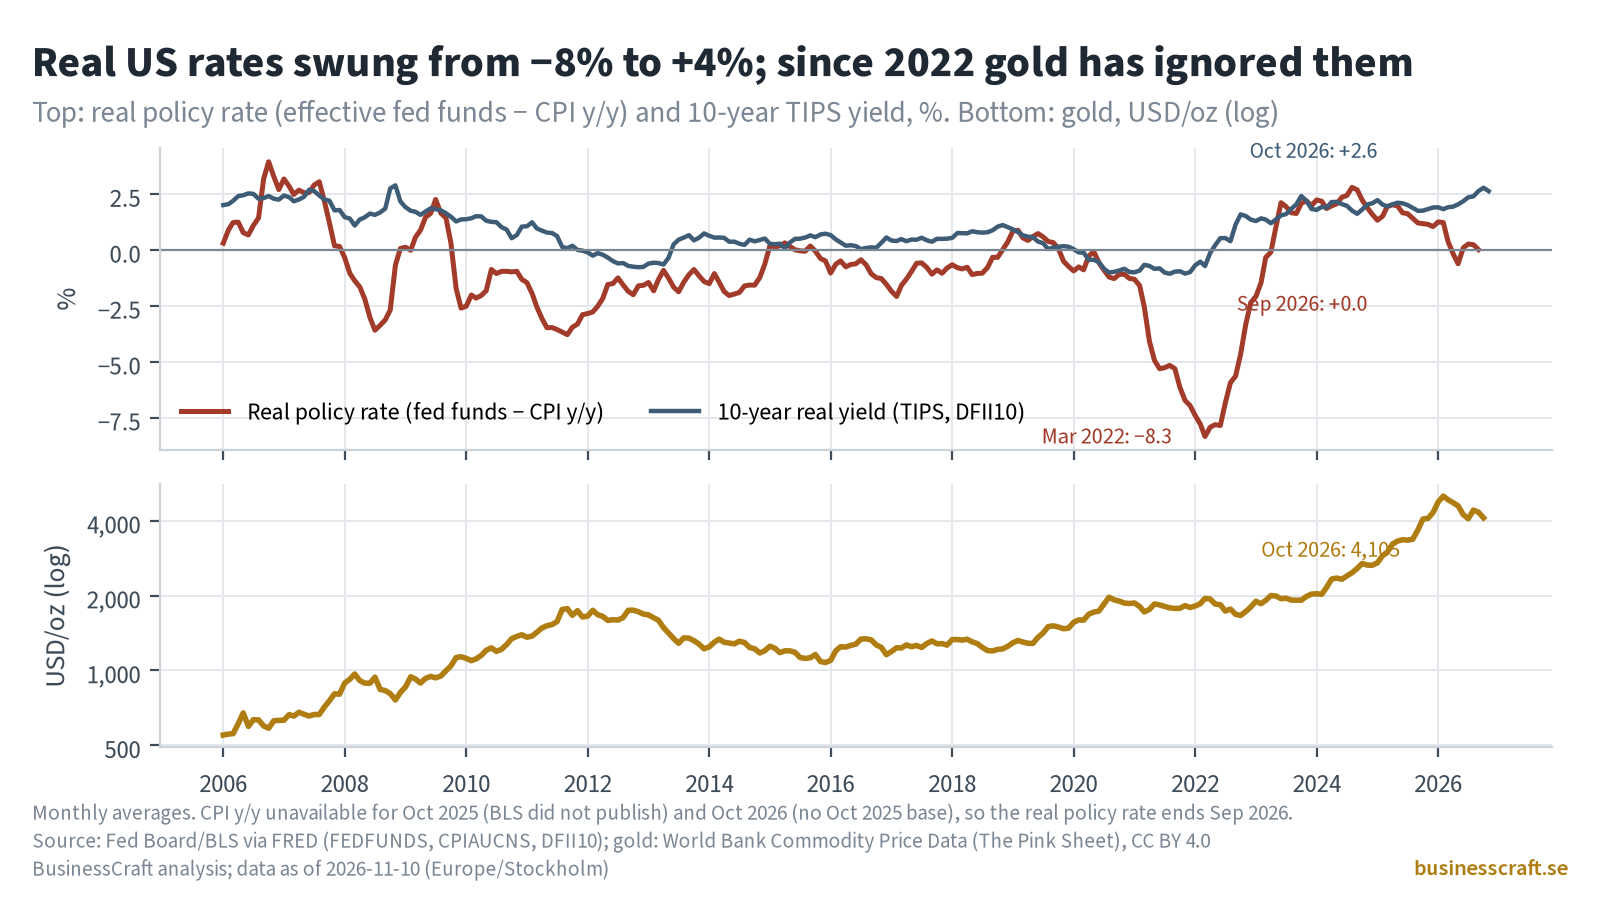
US real interest rates jumped after 2022, yet the gold price kept rising.
The anchor
The gold-anchored GAVF™ charts start from the monthly gold price.
Homes, pay and the krona, measured in gold.
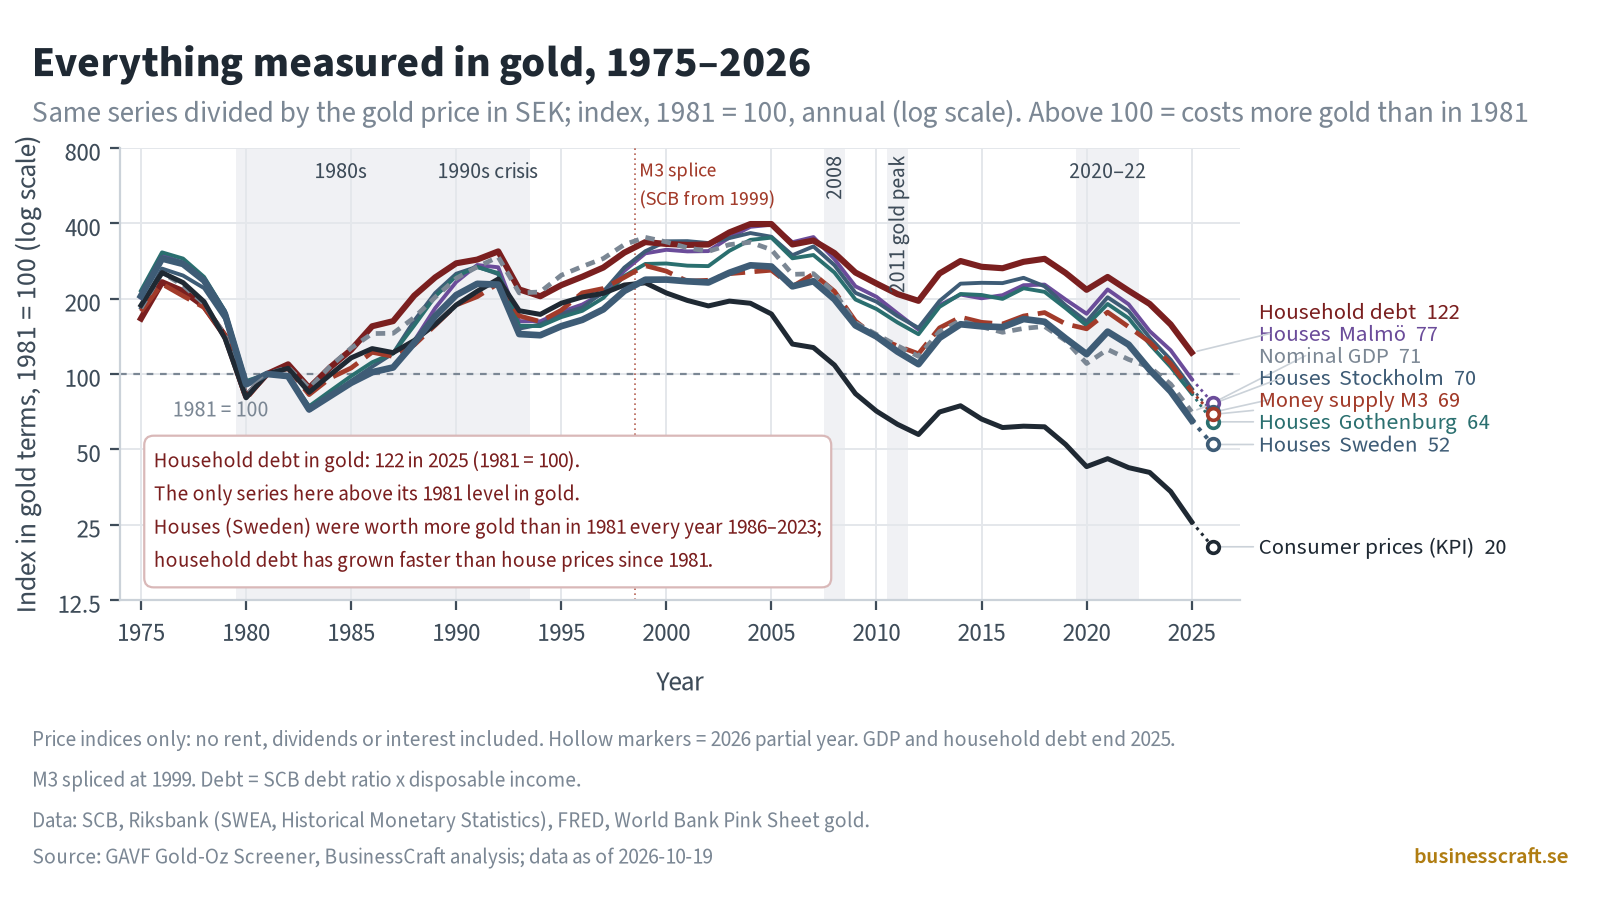
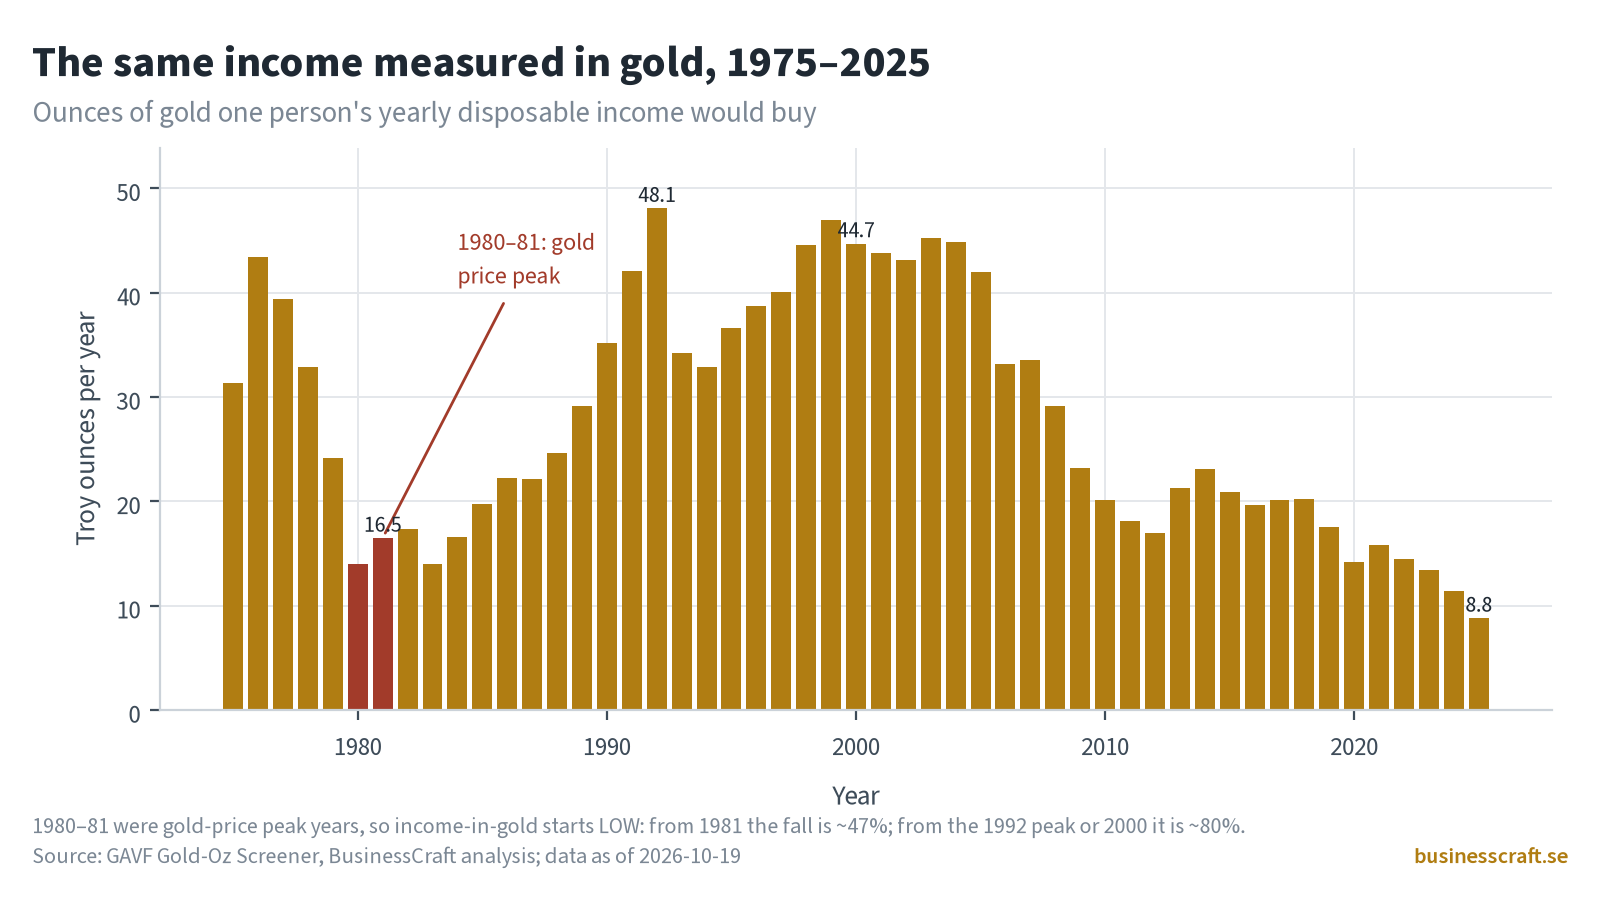
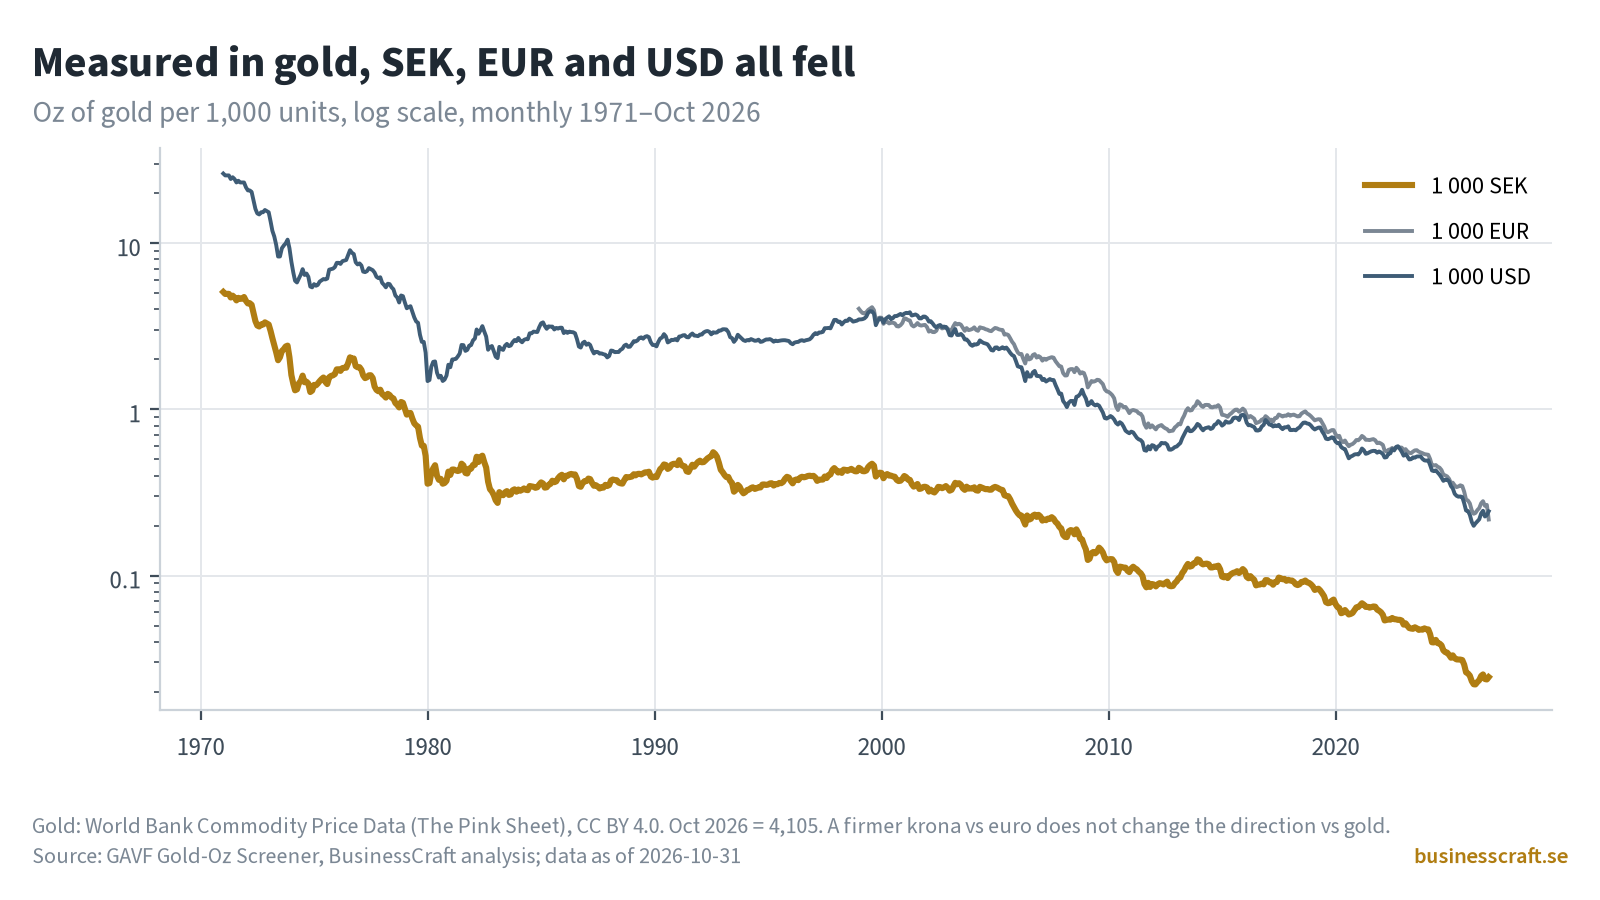
Data in the published GAVF™ charts: SCB; ECB statistics; OECD (2026), Main Economic Indicators, broad money, via FRED (accessed on the date shown on each chart); Board of Governors of the Federal Reserve System (H.6 and H.10) via FRED; U.S. BLS via FRED; Sveriges riksbank; World Bank Commodity Price Data (The Pink Sheet), CC BY 4.0. BLS.gov cannot vouch for the data or analyses derived from these data after the data have been retrieved from BLS.gov. Retrieved dates are shown on each chart. Calculations and charts: BusinessCraft. Sources and licences.
Sketches of what we are building. No real figures or dates are shown.
Pick a currency, money measure or asset and see it in gold, for the history available in your plan.
Compare companies by their value in ounces, and see how per-share value has grown or been diluted.
See how energy, banks, consumer staples and other groups have held their value in gold.
Set a company's earnings against its price, both measured in gold.
See what a holding has been worth in gold once dividends are counted.
Follow rates after inflation next to the krona and gold in one view.
The published snapshot charts on this page are open to everyone. The 24-month and 5-year windows apply to the gold chart on this page and to the interactive GAVF™ features we are building.
| Free | Basic Free registration | Pro (coming soon) | |
|---|---|---|---|
| Published GAVF™ charts and analyses, including the yearly series | ✓ | ✓ | ✓ |
| Gold in USD, SEK and EUR (this page) | 24 months | 5 years | Full history |
| Interactive GAVF™ charts, monthly series (money, currencies, prices in gold) – coming | 24 months | 5 years | Coming |
The 24-month and 5-year windows apply to BusinessCraft's own interactive charts (the gold chart on this page, and the interactive GAVF™ features we are building). They do not limit the published snapshot charts, which are open to everyone. Open official series in the data catalogue show their full published history to everyone, including logged-out visitors.