Correction, 7 November 2026: SSAB’s company value in gold was overstated (142, then 104 at the provisional gold price) because its price history before the 2016 rights issue was adjusted while its share count was not. AT&T’s share count rose 32.1%, not −0.2%. Section 4 figures moved by under one percentage point; the conclusion is unchanged.
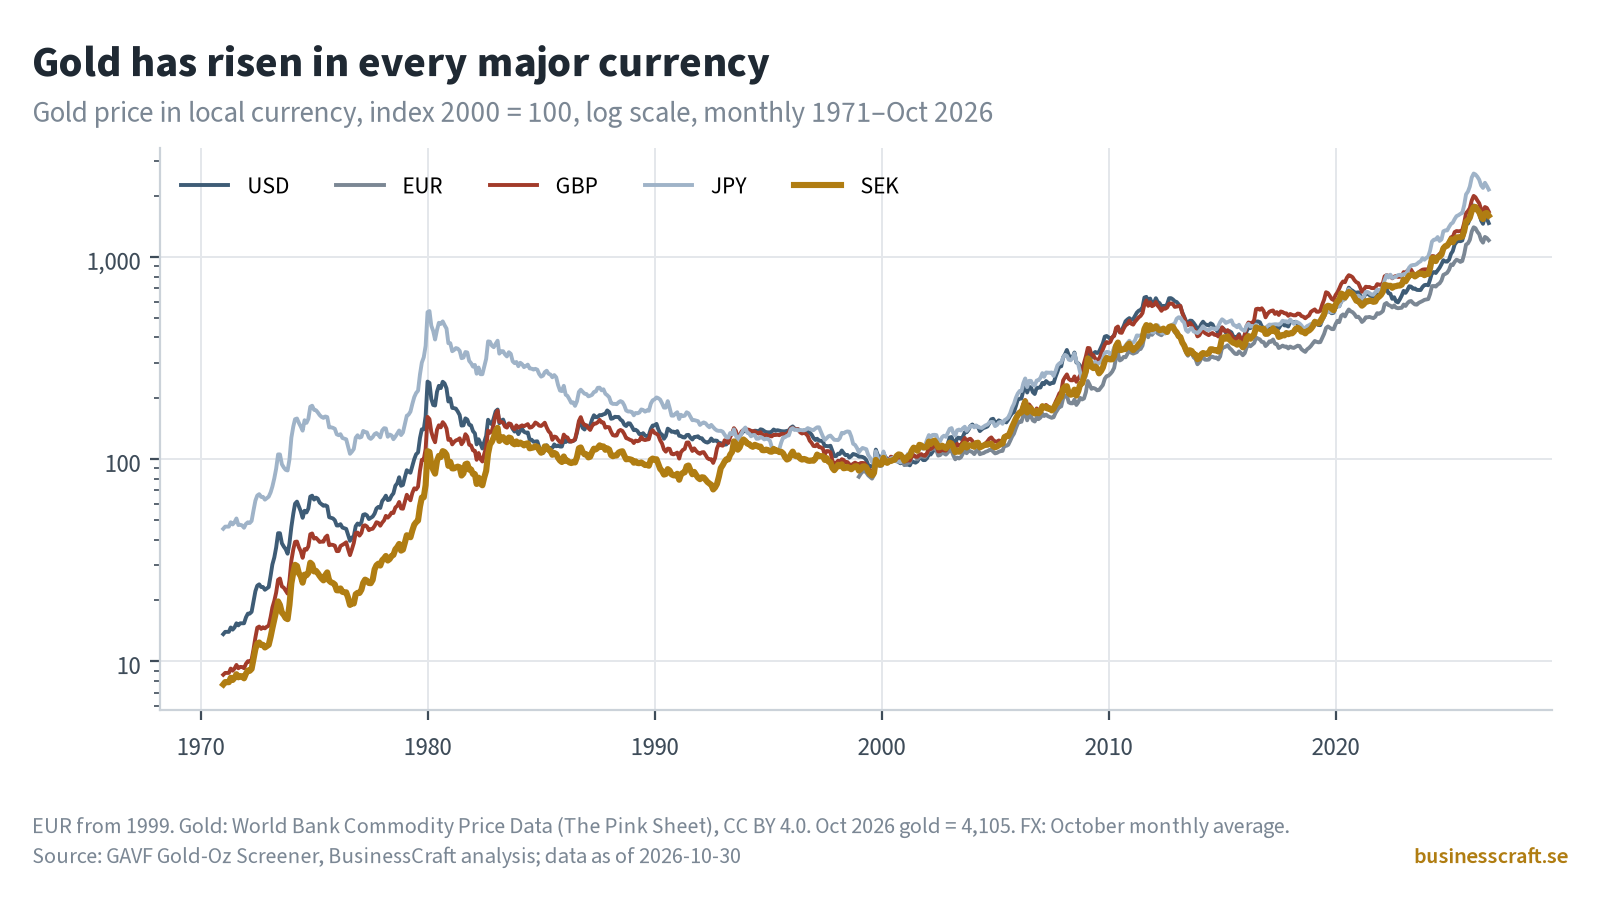
Gold source update, 10 November 2026: October 2026 gold is now the World Bank Pink Sheet monthly average of USD 4,105/oz (it was a provisional futures close of USD 4,196/oz). That raises October ounce sizes and the end-points of the gold-index charts by 2.2%. SSAB’s company index is now 106. Section 4 is unchanged (October is excluded from the backtest). Gold: World Bank Commodity Price Data (The Pink Sheet), CC BY 4.0.
This is not investment advice and nothing here is a buy or sell idea.
Share buybacks are usually reported in dollars and share counts. Our Gold-Oz Screener (GAVF v2.2) asks something different: what happens if you measure a company in troy ounces of gold instead of in currency? We ran 36 large US and Nordic companies through the screener. Who actually got smaller, and did it help shareholders in gold terms?
1. Who shrank, who issued
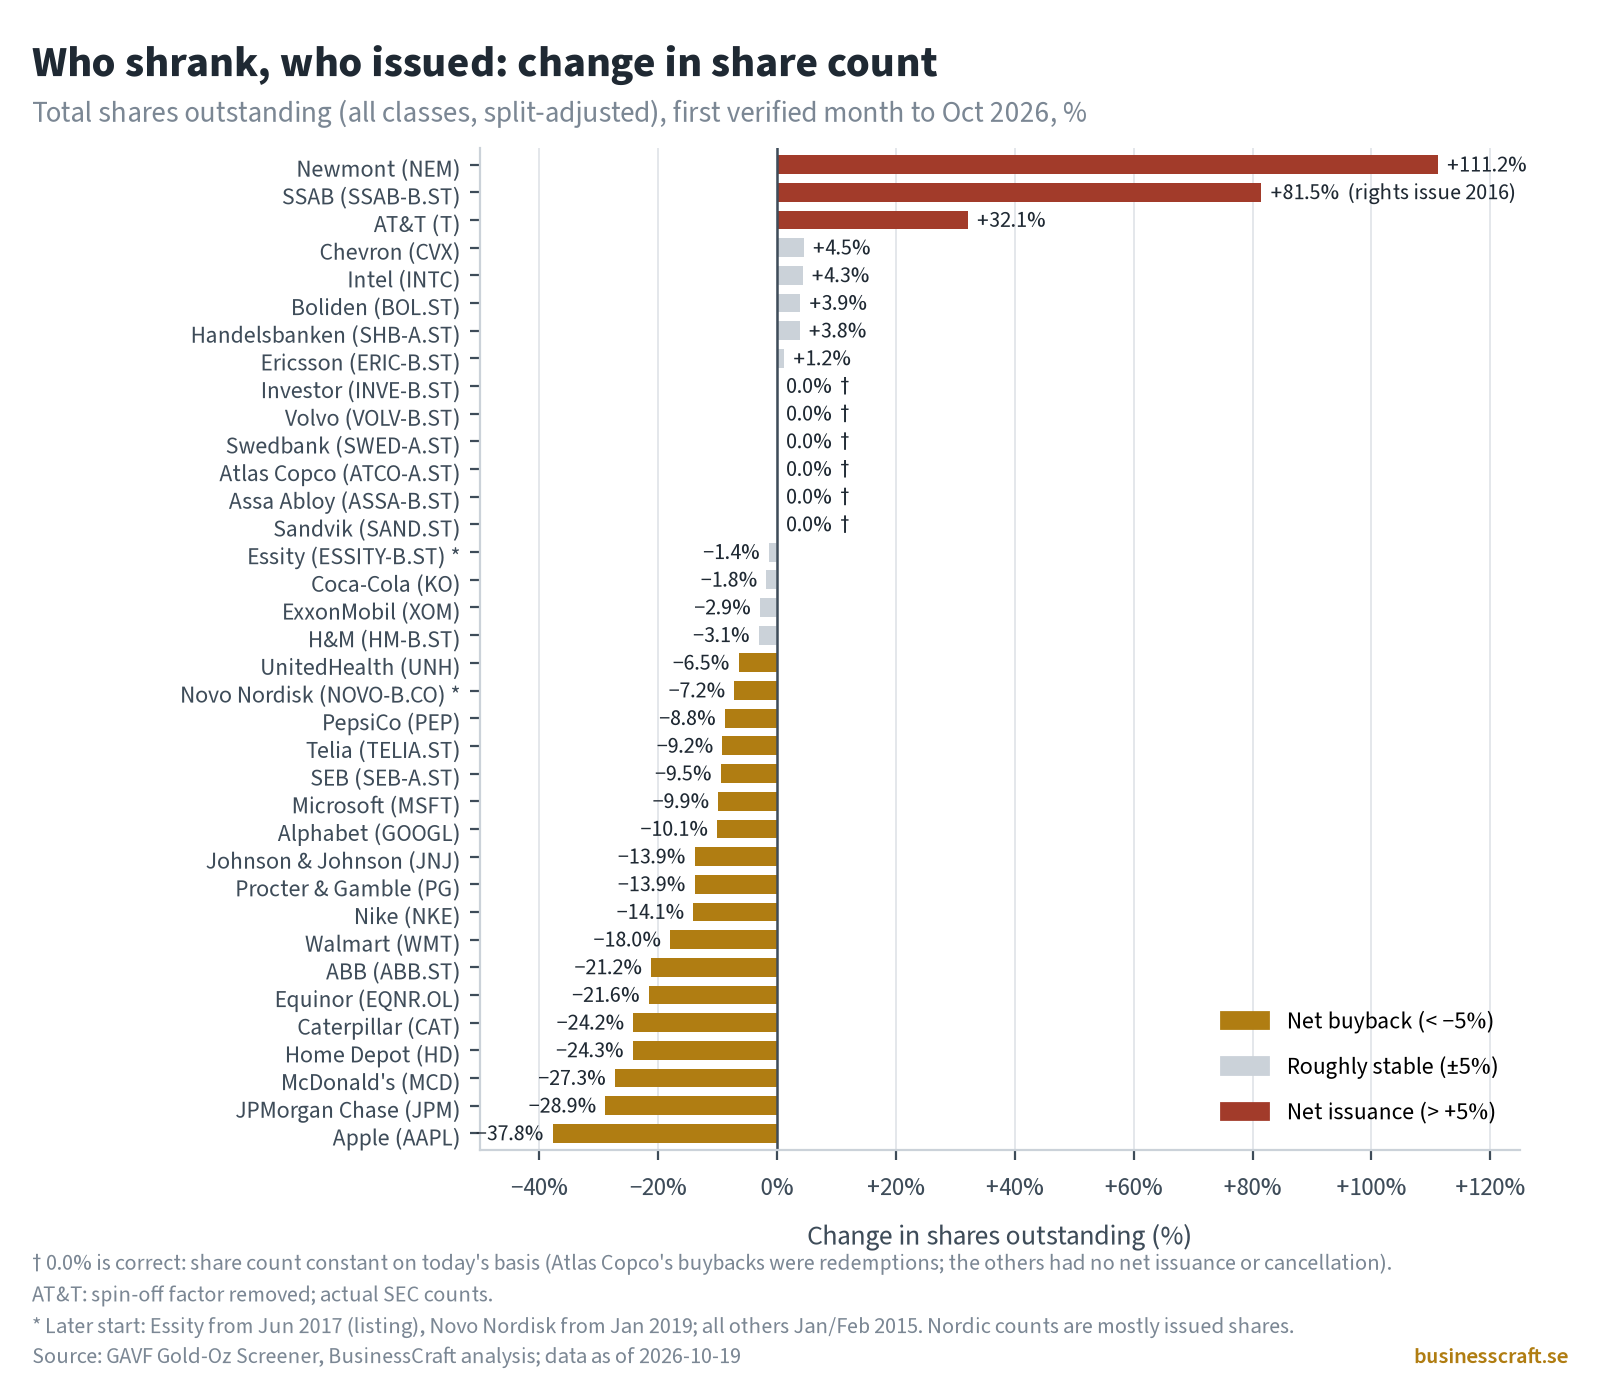
From early 2015 to October 2026, 18 of the 36 companies cut their share count by more than 5%. Apple cut its count the most, by 37.8%, followed by JPMorgan Chase (−28.9%), McDonald’s (−27.3%), Home Depot (−24.3%) and Caterpillar (−24.2%). Three companies went the other way: Newmont’s share count rose 111.2%, SSAB’s 81.5% (its 2016 rights issue, net of later cancellations) and AT&T’s 32.1%, mainly from shares issued to buy DirecTV in 2015 and Time Warner in 2018. The other 15 stayed within ±5%. Six of them show exactly 0.0%: Sandvik, Investor, Atlas Copco, Swedbank, Assa Abloy and Volvo. That is correct: on today’s share basis their counts never changed. Atlas Copco returned cash through redemption programmes rather than by cancelling bought-back shares, and the other five had no net issuance or cancellation. Share counts are split-adjusted and include all share classes. Spin-offs are not splits, so AT&T’s count is not scaled for the 2022 WarnerMedia spin-off. Essity starts in June 2017, when it listed, and Novo Nordisk starts in January 2019.
2. Per share versus the whole company
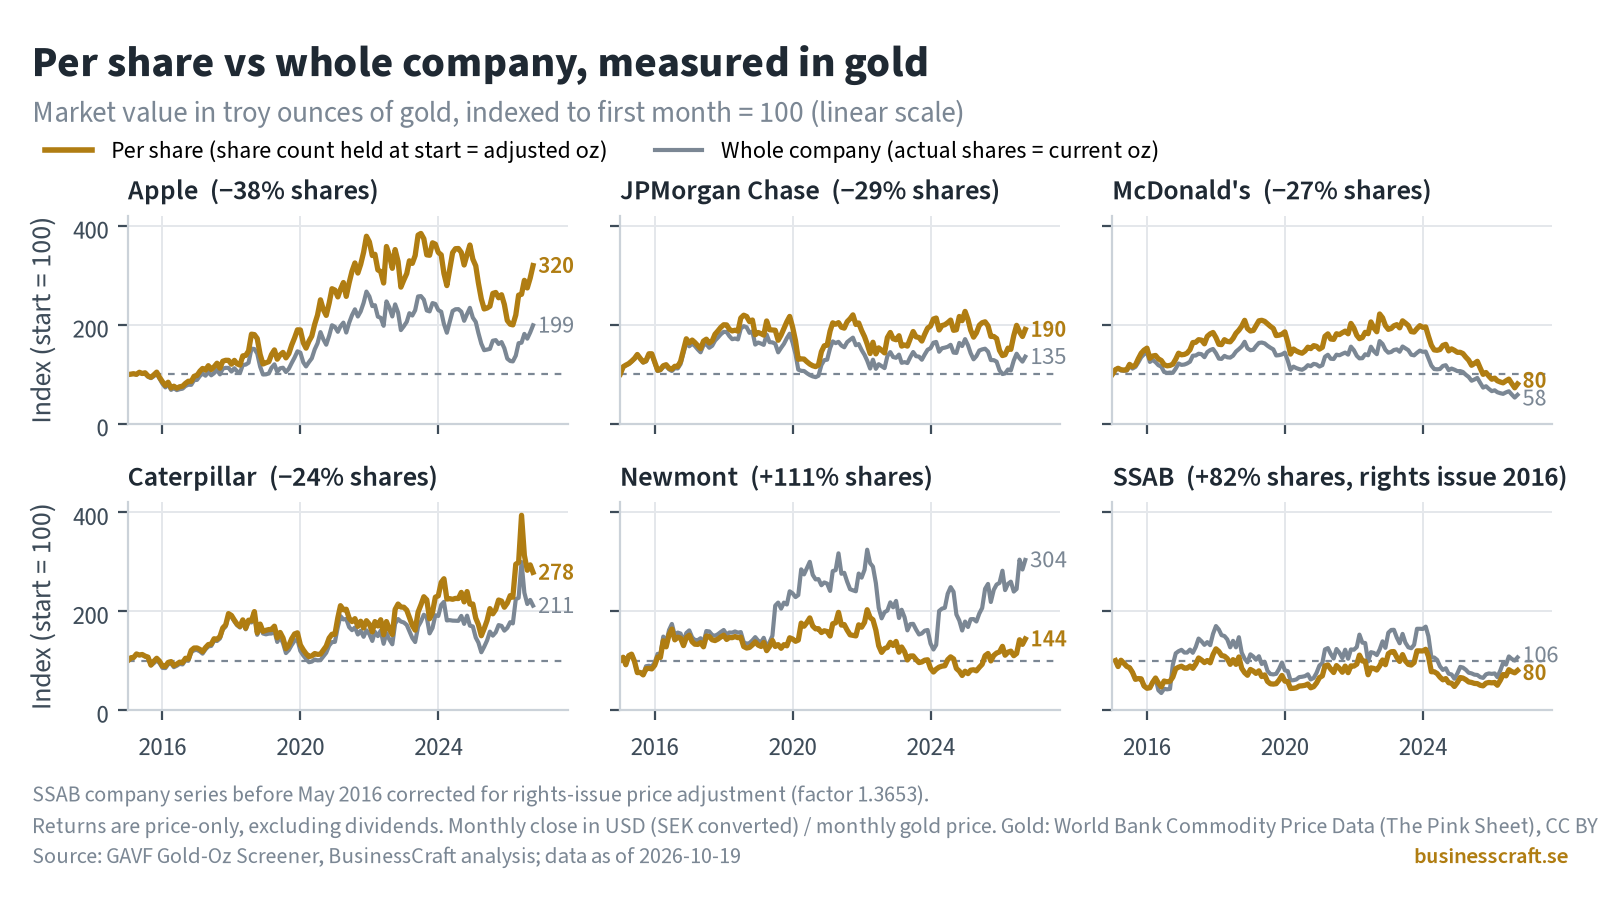
Each panel shows two lines, both indexed to 100 at the start. The gold line is the per-share value in gold: market value with the share count held at its 2015 level. The grey line is the whole company in gold, using the actual share count. Buybacks push the gold line above the grey one, and issuance pushes it below.
Apple’s per-share value in gold ended at 320, while the whole company ended at 199. JPMorgan ended at 190 versus 135, and Caterpillar at 278 versus 211. McDonald’s is the reminder that buybacks don’t guarantee anything. Its whole company shrank to 58 in gold terms and its per-share value to 80, so the buybacks softened the fall without preventing it. Newmont is the mirror image. The company grew to 304 in gold, mostly by issuing shares, but per-share value only reached 144. SSAB shows the cost of issuing shares even more clearly. The whole company ended at about 106 in gold, almost where it started, even though SSAB raised about SEK 5 billion in a rights issue in 2016. The per-share line ended at 80. That figure assumes a shareholder sold or used the subscription rights. A holder who let them lapse ended at 59.
All returns here are price-only, excluding dividends. Total returns are therefore understated, most of all for companies that pay out a lot.
3. How big is each company in gold?
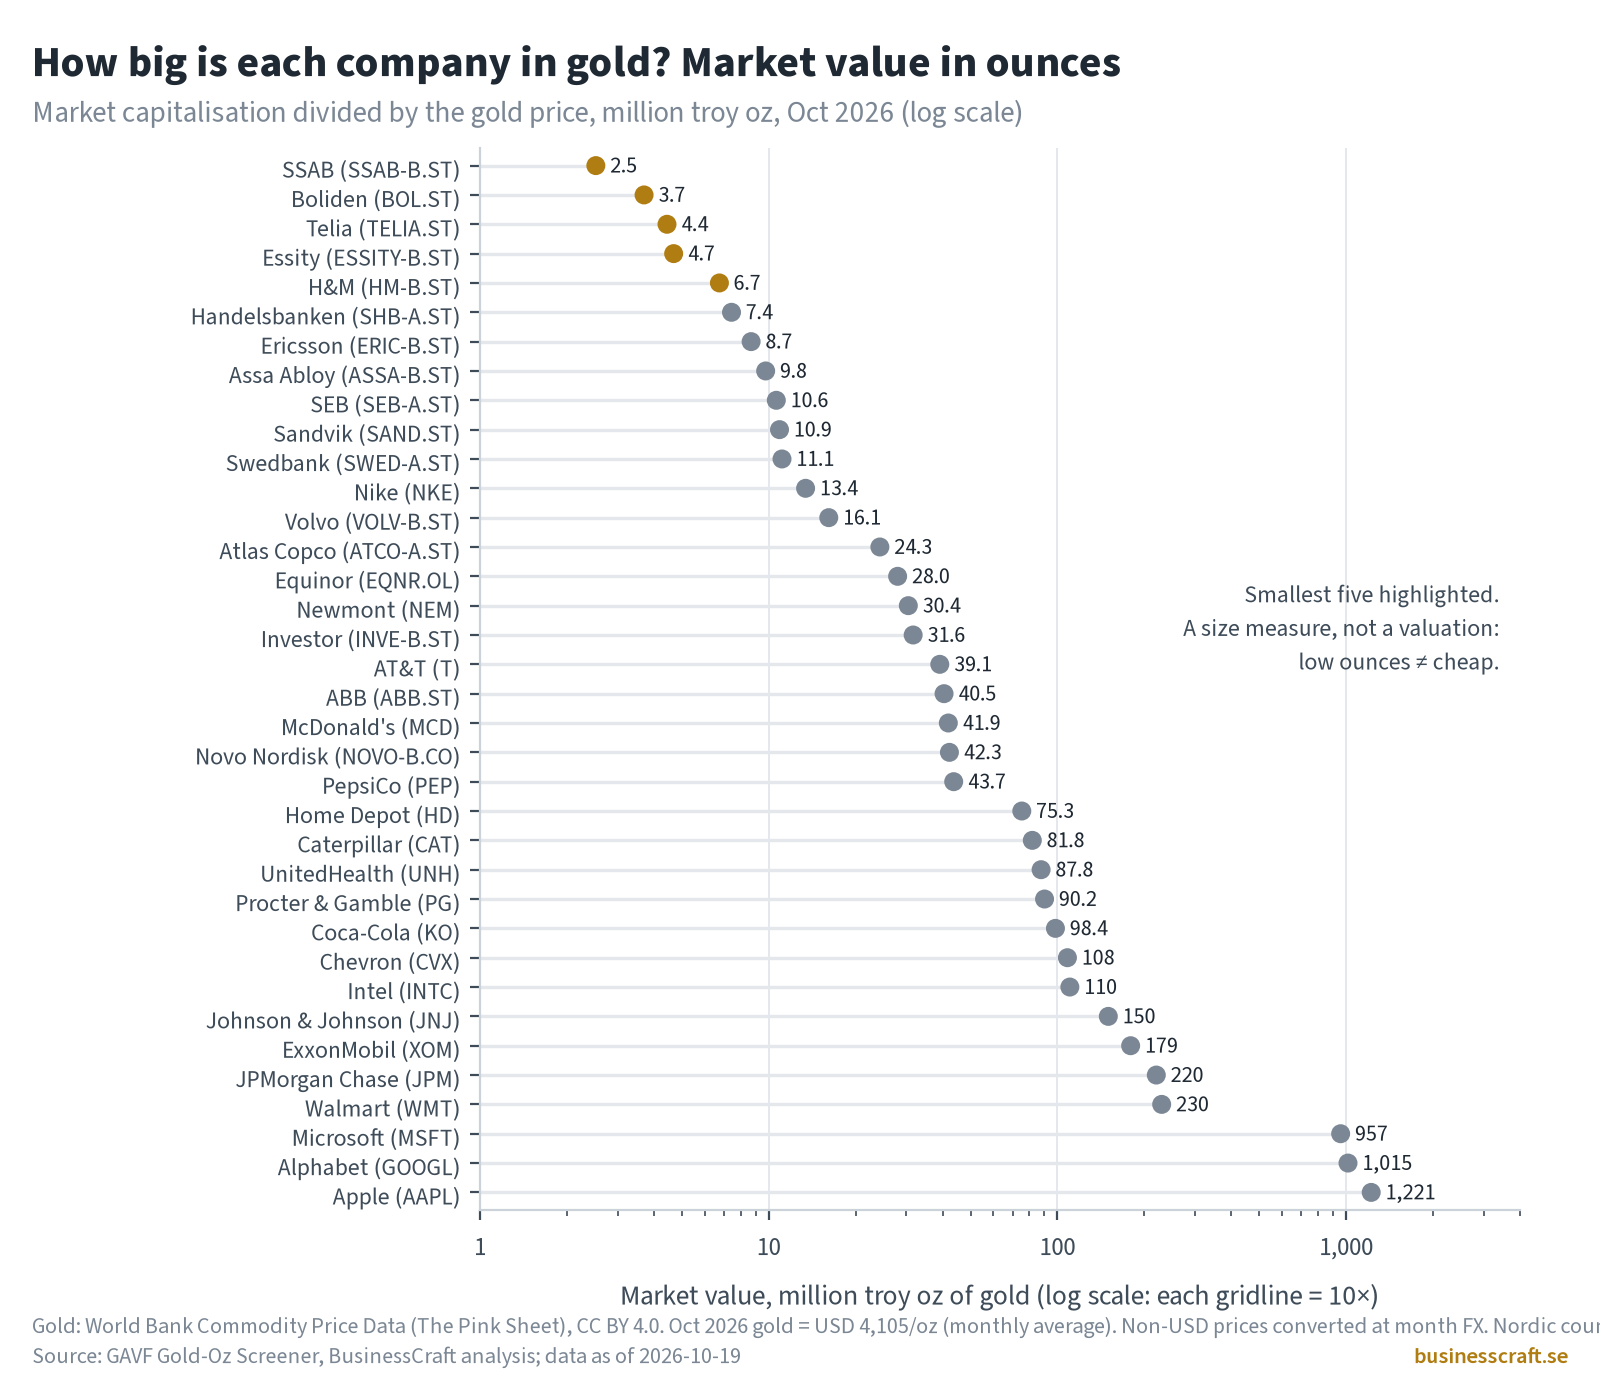
At a gold price of USD 4,105/oz (World Bank Pink Sheet monthly average), Apple is worth about 1,221 million ounces, Alphabet 1,015 million and Microsoft 957 million. The smallest companies in our sample are SSAB (2.5 million oz), Boliden (3.7), Telia (4.4), Essity (4.7) and H&M (6.7).
This is a measure of size, not of value. A low ounce figure just means a smaller company. It doesn’t make the company cheap, and nothing in the next section suggests it predicts anything.
4. Did low ounce levels predict anything?
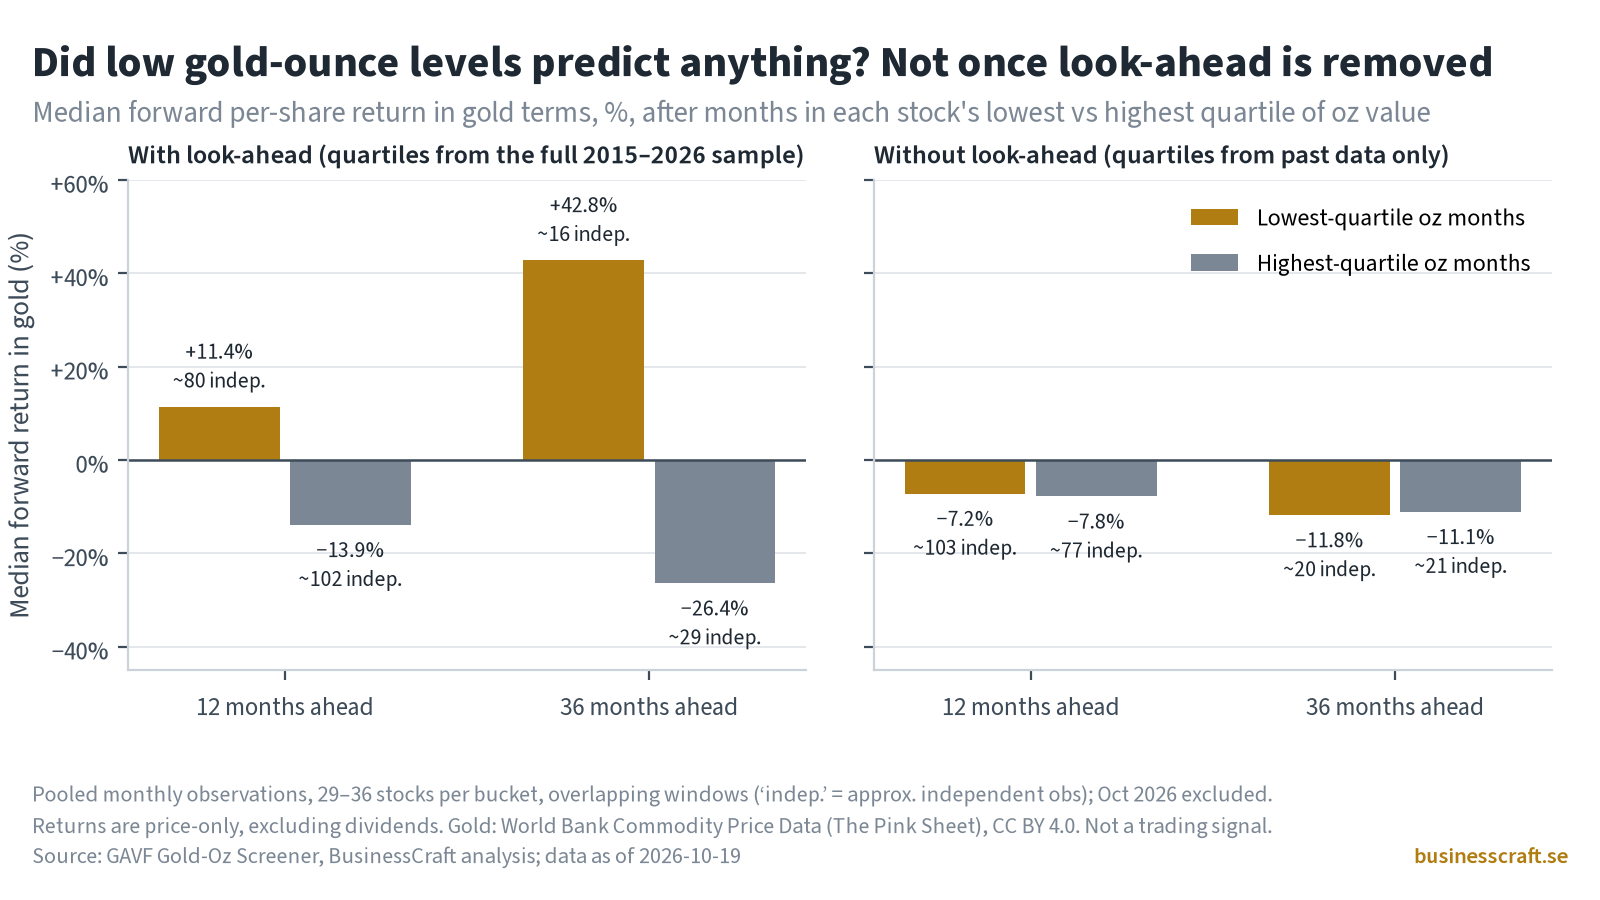
As before, returns are price-only, excluding dividends. We checked whether months when a stock sat in its own lowest quartile of gold-ounce value were followed by better per-share gold returns than months in its highest quartile.
Run naively, with quartiles taken from the full 2015–2026 history, the answer looks like a clear yes. At 36 months the median was +42.8% after low months and −26.4% after high months. But that version uses future data: whether a month counts as “low” depends on prices that came later.
Once the quartiles are built only from data available at the time, the gap disappears. At 12 months the medians were −7.2% (low) and −7.8% (high). At 36 months they were −11.8% and −11.1%. The averages lean slightly towards the low bucket (−1.6% vs −5.9% at 12 months, and −4.4% vs −6.8% at 36 months), but with overlapping windows and only about 20 independent observations per bucket at 36 months, that is well within noise. We found no edge.
Limits and caveats
- 36 companies, one period (2015–2026), heavily shaped by gold’s rise from a USD 1,251 monthly average in January 2015.
- All returns are price-only, excluding dividends.
- October 2026 prices are month-to-date (as of 19 October). Gold: World Bank Commodity Price Data (The Pink Sheet), CC BY 4.0. October 2026 = USD 4,105/oz (monthly average). Earlier months in this 2015–2026 window use the same Pink Sheet monthly averages, which match the previous series to the dollar.
- Nordic share counts are mostly issued shares, so treasury shares (about 1–3%) are not deducted. The price histories are adjusted for rights issues and spin-offs, but the share counts are not. That makes company values before those events too low: SSAB’s 2016 rights issue (corrected above), and spin-offs at Atlas Copco (2018), Handelsbanken (2021), Sandvik (2022) and ABB (2022), which are not corrected. The per-share lines follow the adjusted prices. They assume rights and spin-off shares were sold or kept at their theoretical value, and they exclude dividends.
- No statistical significance test was run in v2.2.
Sources
Source: GAVF Gold-Oz Screener, BusinessCraft analysis; share and price data as of 2026-10-19. Gold: World Bank Commodity Price Data (The Pink Sheet), CC BY 4.0. Not investment advice.