Educational analysis, not investment advice. No trading signals; descriptive only.
October 2026 brought a headline Swedes like: the krona strengthened. EUR/SEK went from about 11.33 at the start of the month to 10.978 on 30 October (Riksbank mid rate). That is worth enjoying. It is also worth placing in a longer frame, against the dollar, euro and pound over several decades, and against the GAVF measuring stick: gold.
1. The October move in context (charts 1 and 2)
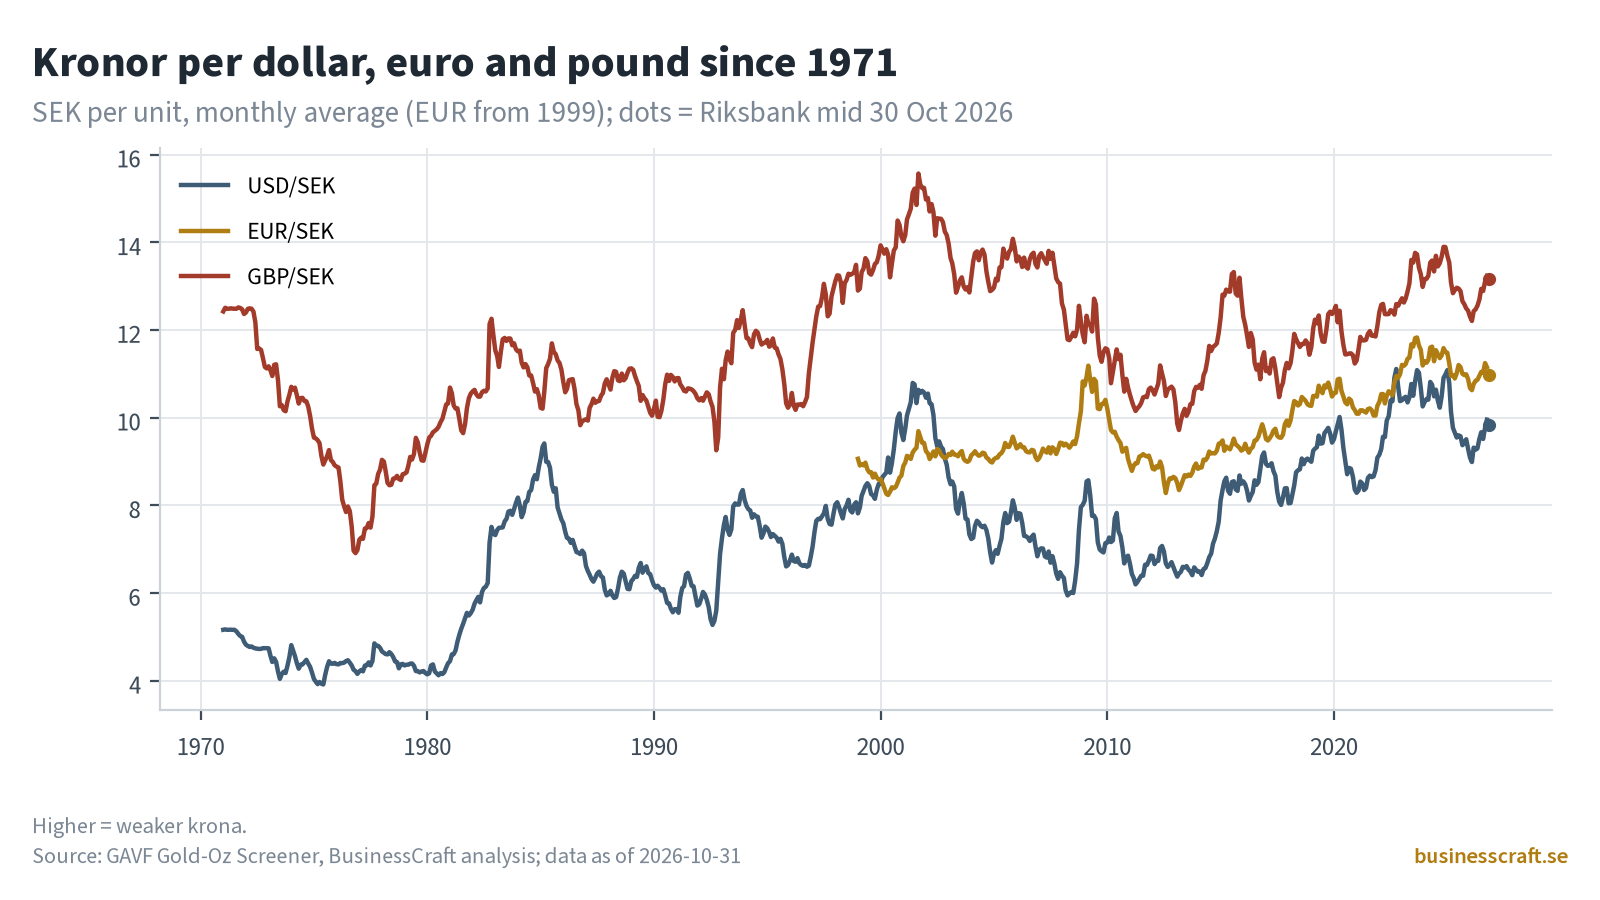
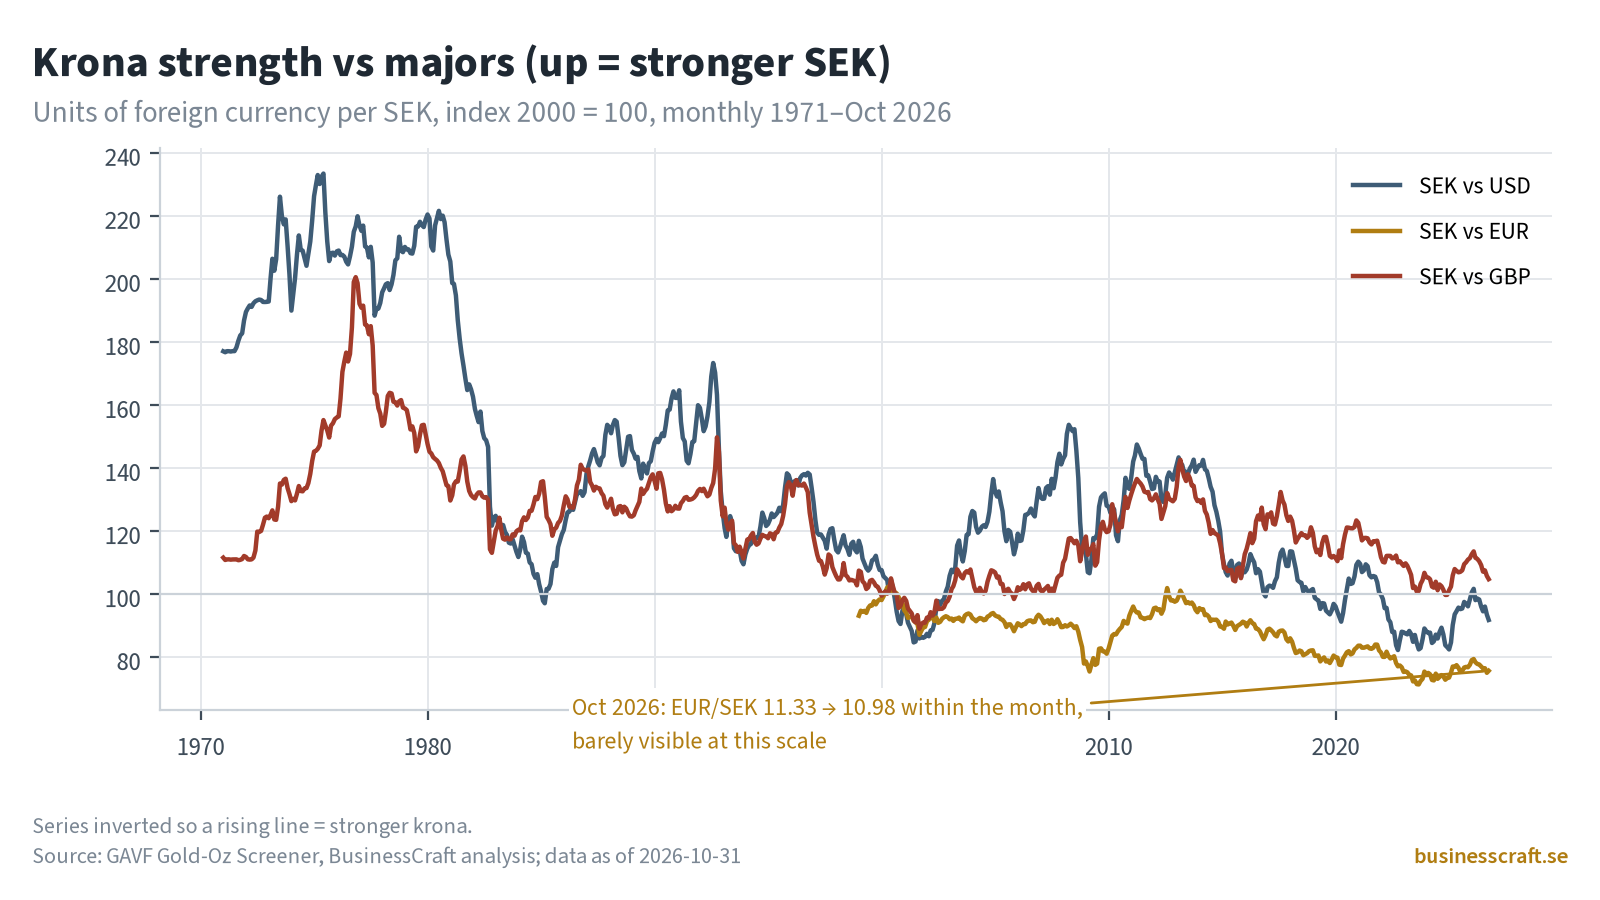
The October firming against the euro is about 3.1% (11.33 → 10.98 by 30 October). Set that beside where the krona started the century. EUR/SEK averaged 8.45 in 2000; at 10.98 on 30 October it is still about 30% weaker against the euro than then. One good month is a tenth of that distance.
Against the dollar the picture is similar but milder: USD/SEK averaged 9.18 in 2000 and stood at 9.83 on 30 October. The pound is the exception. GBP/SEK averaged 13.88 in 2000 and was 13.17 on 30 October, so the krona is actually a little stronger against sterling than it was then.
Chart 1 shows the three crosses month by month, with the 30 October Riksbank mids as dots. Chart 2 turns them into a strength index (up = stronger krona, 2000 = 100), which makes the long slide against the euro and dollar, and the small October uptick, easy to see.
2. The real effective krona (Chart 4)
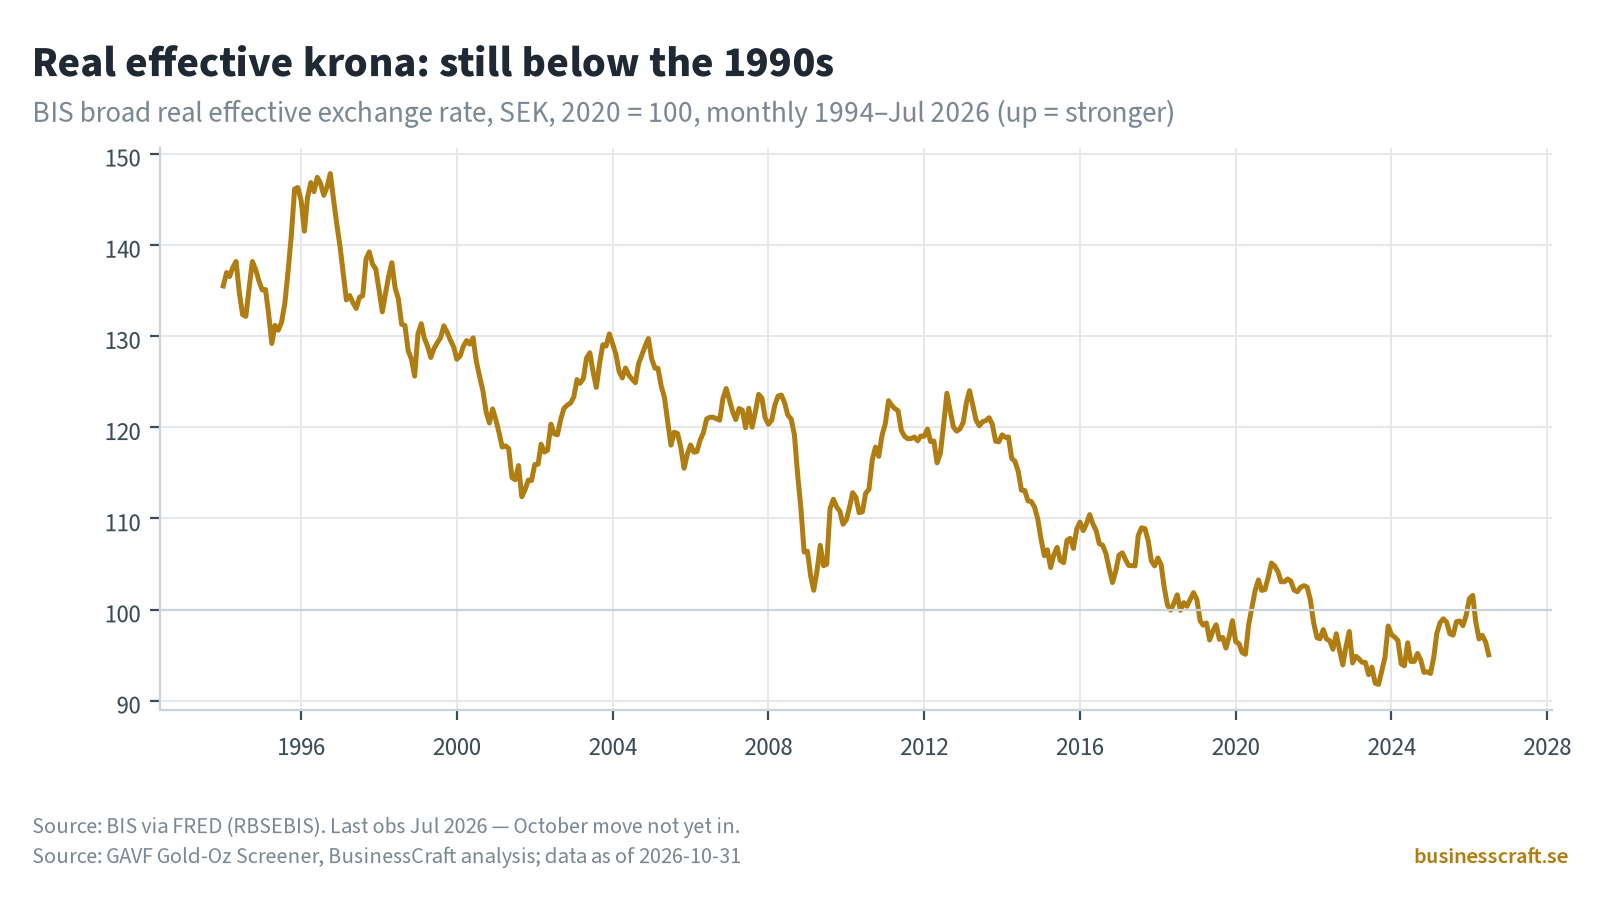
Bilateral rates only tell part of the story. The BIS broad real effective exchange rate weighs the krona against many trading partners and adjusts for inflation differences. On that measure (2020 = 100) the krona stood at 135.5 in January 1994 and 95.0 in July 2026, roughly 30% lower. The latest reading is from July, so October’s move is not yet included.
3. Measured in gold (Chart 3)
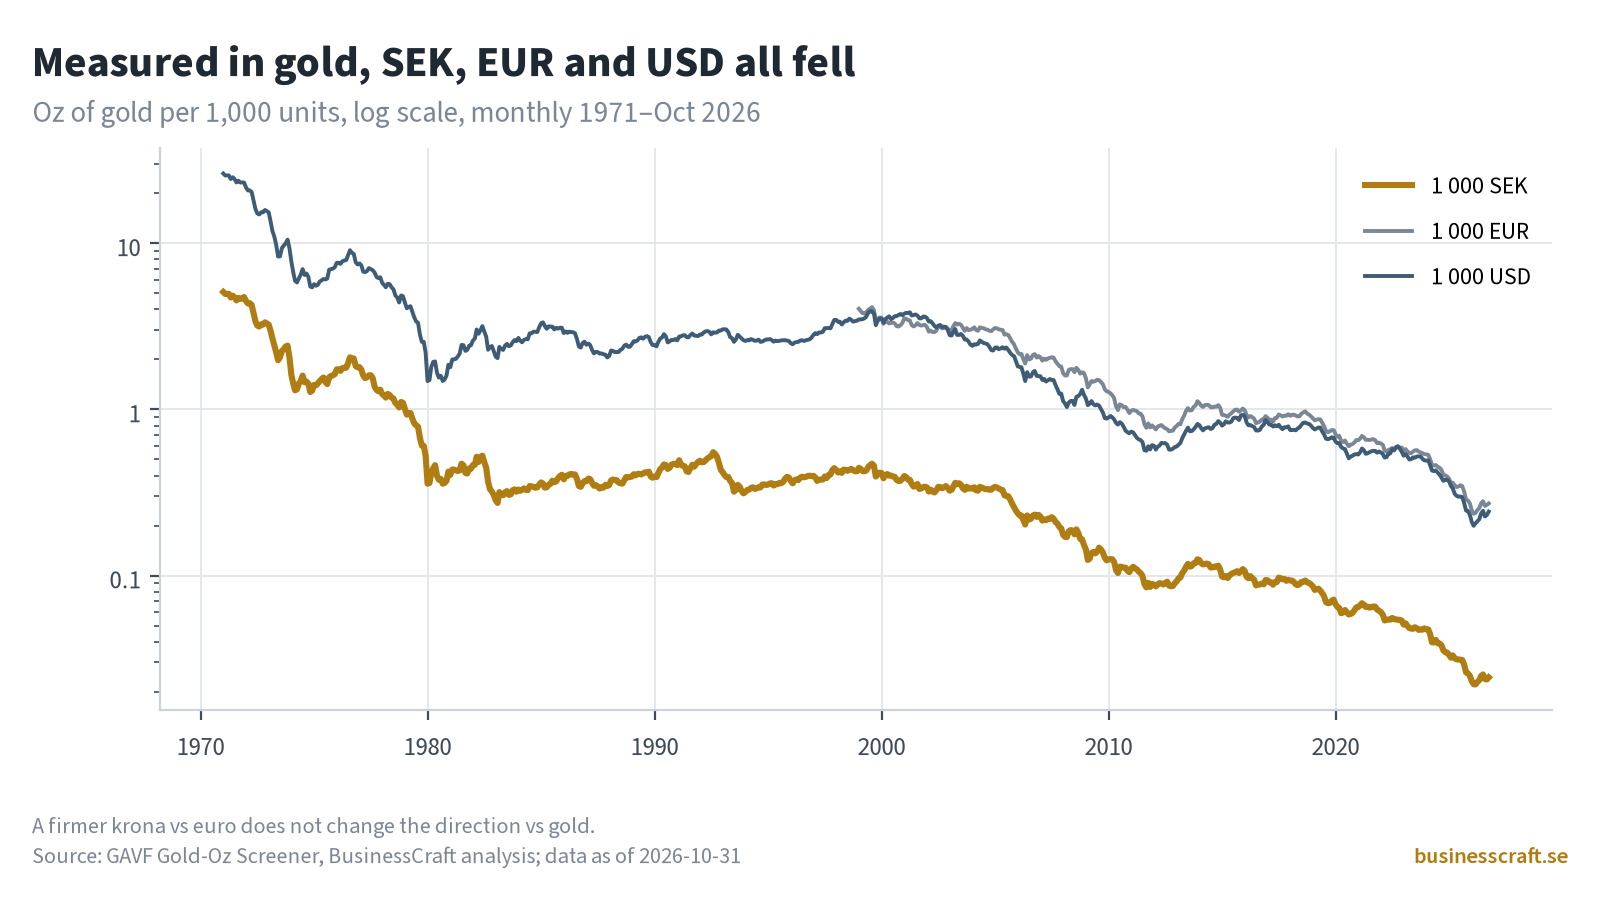
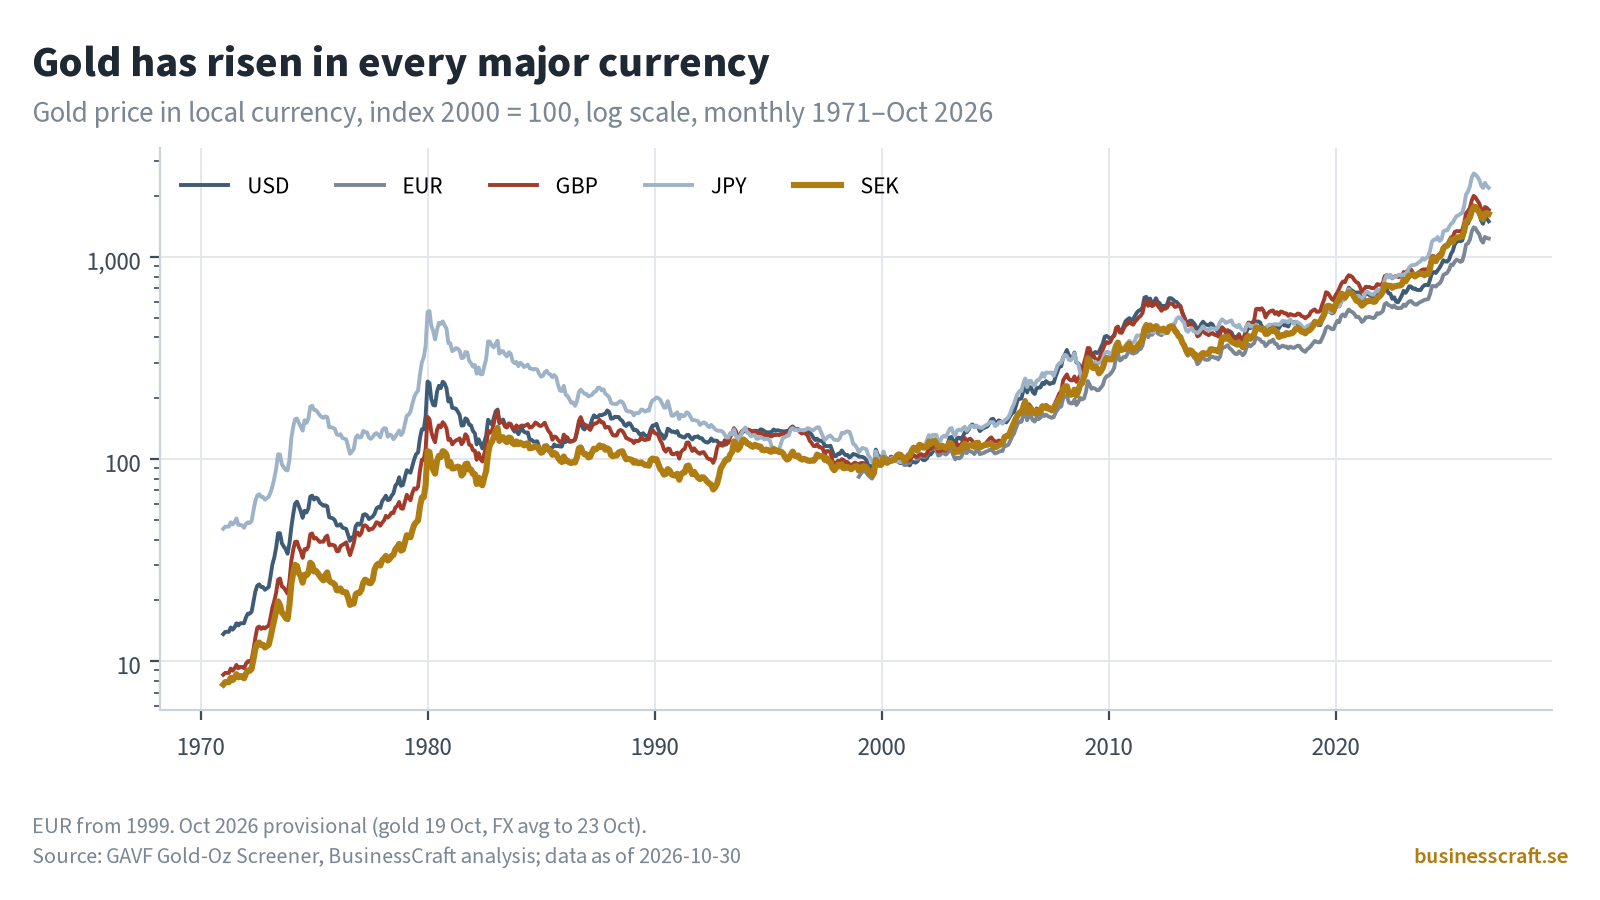
Now change the yardstick. In 2000, 1,000 SEK bought about 0.39 oz of gold. In October 2026 it bought about 0.0244 oz (gold provisional average about 4,121 USD/oz for the month). The euro and the dollar fell the same way (see post 06: about −92% and −93% since 2000). A firmer krona against the euro is a move inside the fiat contest; it does not change the direction against gold. As in post 06, remember that 2000 sat near a gold low, which makes the losses look larger than a 1980 starting point would.
4. The rate backdrop (framing only)
At the data freeze the Riksbank policy rate was 1.75%, the ECB deposit rate 2.50% and the US Fed funds range 3.75–4.00%. Rate differences are one of many things that move exchange rates. We mention them for context, not as an explanation of October and not as a forecast.
The takeaway
Enjoy the October bounce. But over 25 years the krona is weaker against the euro and dollar, its real effective value is lower than in the mid-1990s, and measured in gold it has lost most of its buying power alongside the other major currencies. A single month does not rewrite that story, and nothing here is a trading signal.
Limits and caveats
- Riksbank mid rates for 30 October 2026 (EUR/SEK 10.978, USD/SEK 9.83, GBP/SEK 13.17) were verified against the Riksbank SWEA API on 30 October 2026 (proof:
riksbank-verify-2026-10-31.md, PASS). Start-of-month EUR/SEK ~11.33 matches SWEA 1 October (11.331). - Monthly history for the crosses still relies on FRED via the US dollar for 1971–Sep 2026; October 2026 averages use SWEA daily mids.
- The real effective rate ends July 2026; October is not included.
- EUR/SEK before 1999 is not built.
- October 2026 gold is provisional (GC=F average 1–30 Oct ≈ 4,121.15 USD/oz).
Source: BusinessCraft analysis of FRED exchange rates, BIS real effective exchange rate (via FRED), Riksbank SWEA mid rates and gold (GC=F / LBMA); post-07 data refresh 2026-10-31. Educational analysis, not investment advice. No trading signals. Past data says nothing certain about the future.