Not investment advice. Nothing here is a buy or sell signal.
The popular view is that a Swedish house is “always a safe, good investment”. Here is what the data shows, measured in kronor and in gold, from 1975 to 2026. Every figure is an index (1981 = 100) unless stated otherwise.
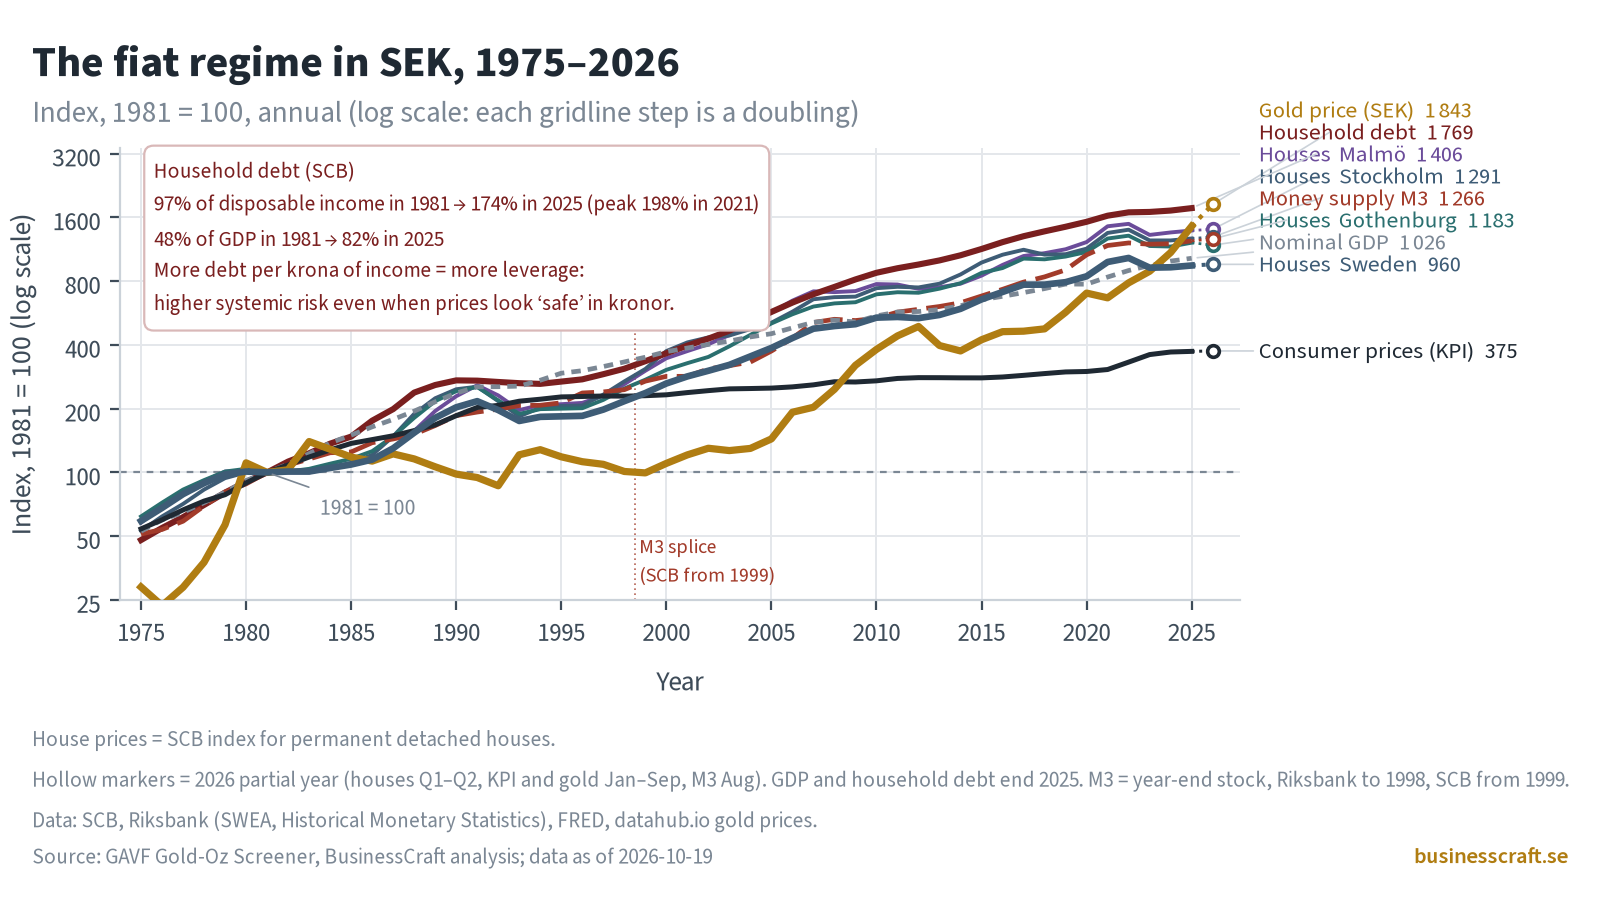
Houses and debt in kronor
In kronor the popular view holds up
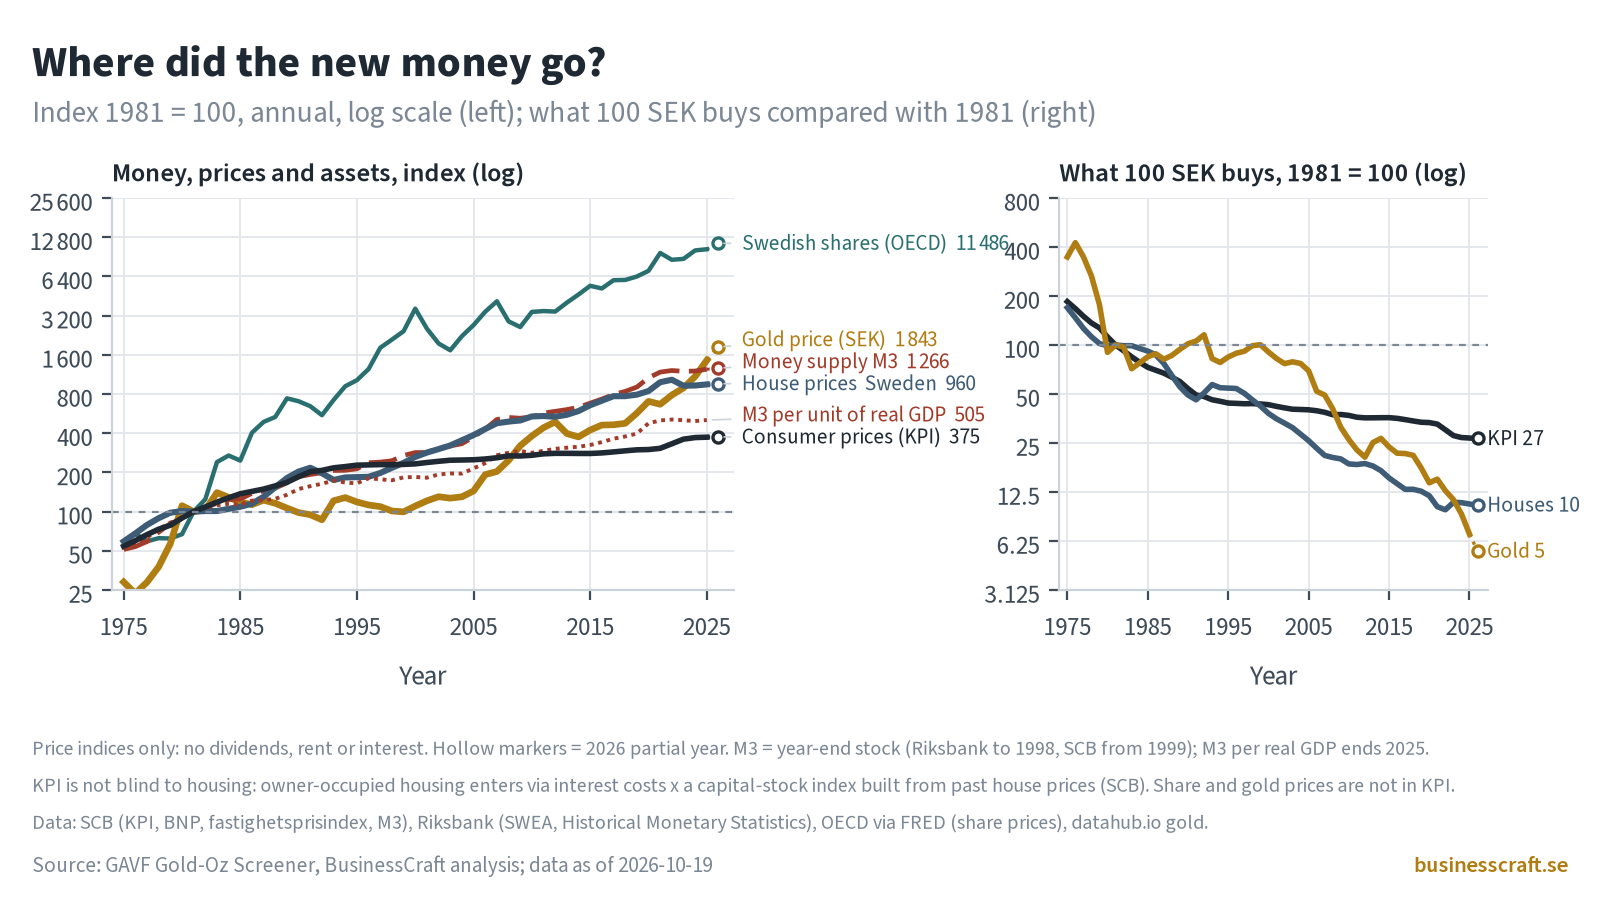
The SCB house-price index for Sweden reached 948 in 2025, against KPI at 373. That is about 2.5× in real terms (KPI-deflated: 2.54). Stockholm reached 1,272. Even so, prices fell in nominal terms twice: 1991→1993 (217→175, −19%) and 2022→2023 (1,029→926, −10%).
Debt grew faster than the houses
Household debt reached 1,769 in 2025, above house prices (948), M3 (1,239) and GDP (1,026). Debt was 97% of disposable income in 1981 and 174% in 2025, after a peak of 198% in 2021. As a share of GDP it went from 48% to 82%. Higher leverage means a given price fall does more damage to household balance sheets, which is a systemic risk even in years when prices look “safe” in kronor. This is a description of risk, not a forecast.
Measured in gold
In gold the picture flips
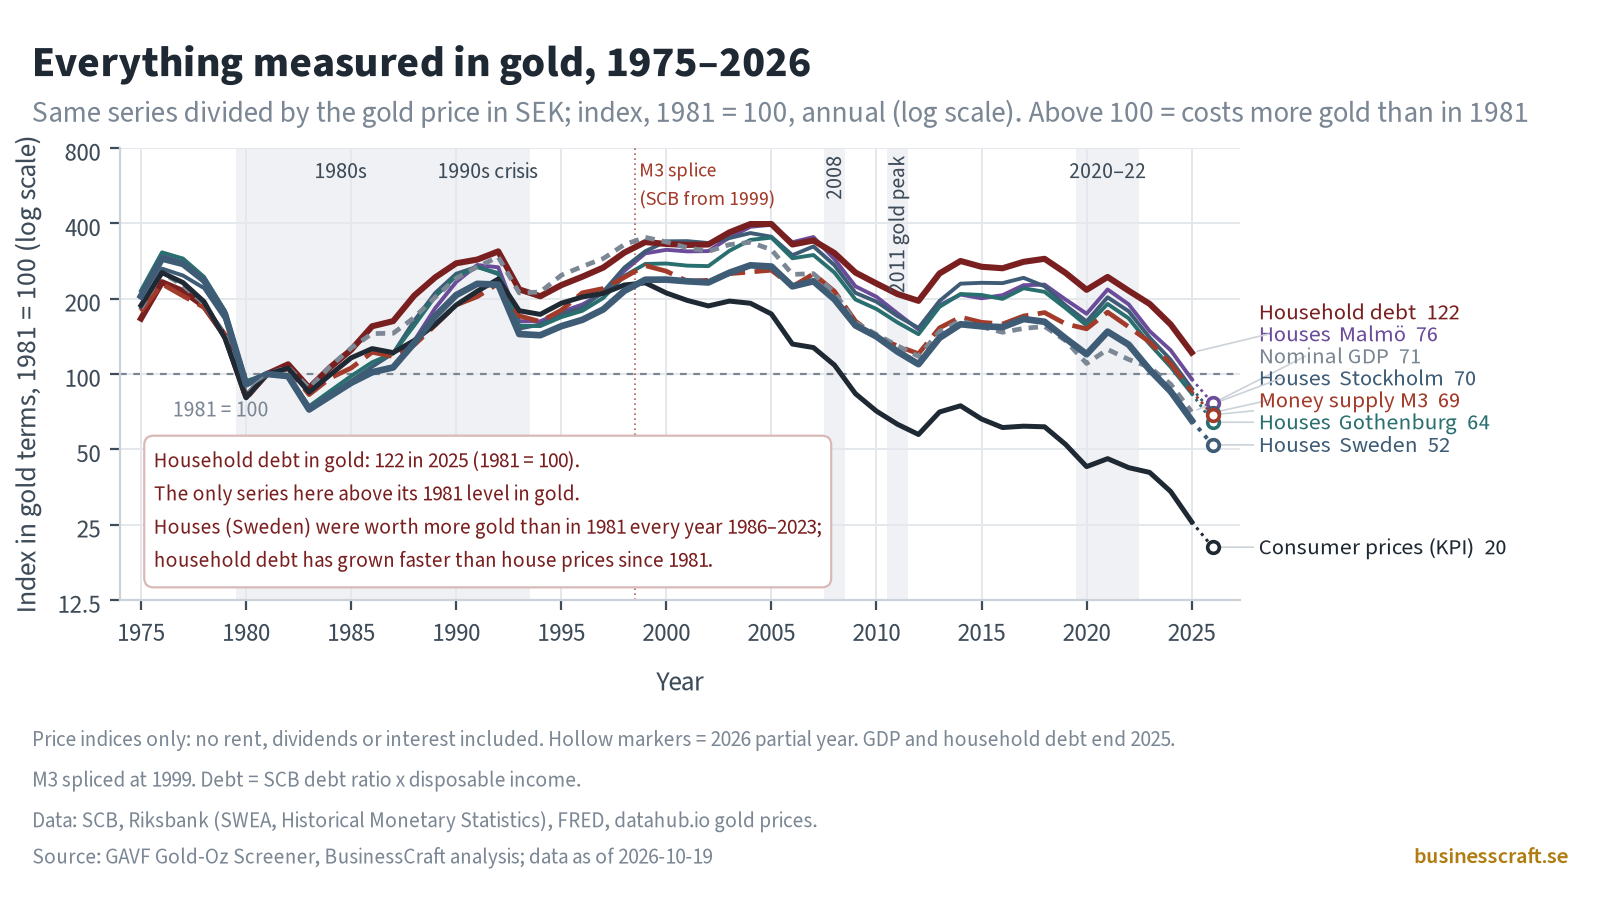
Measured in gold (SEK gold price, 1981 = 100), Swedish houses stood at 52 in 2026 (Q1–Q2) and KPI at 20. Houses were worth more gold than in 1981 every year from 1986 to 2023, with a peak of 272 in 2004, and fell below 100 from 2024. Household debt is the only series still above its 1981 level in gold: 122 in 2025.
Where did the money go?
Partly into assets, but the evidence is not clean
From 1981 to 2025, M3 rose 12.4× while real GDP rose 2.5×, so M3 per unit of real output was 505 in 2025. KPI (373) rose less than that. House prices (948), gold (1,452) and Swedish share prices (10,346, a price index without dividends) rose more. That fits the idea that money growth showed up more in asset prices than in consumer prices. But it is a correlation over one period, not proof, and other forces matter too: interest rates, credit and tax rules, demographics, globalisation of goods prices.
KPI is not blind to housing
Swedish KPI includes owner-occupied housing through interest costs multiplied by a capital-stock index built from past house prices (SCB). So “KPI ignores house prices” overstates the case. It does not include house purchase prices as an asset, or shares, or gold.
What 100 SEK buys, compared with 1981
100 SEK buys 27 by KPI, 10 in house prices, and 5 in gold (2026 partial year).
Incomes versus houses
Houses outgrew incomes, and debt outgrew both
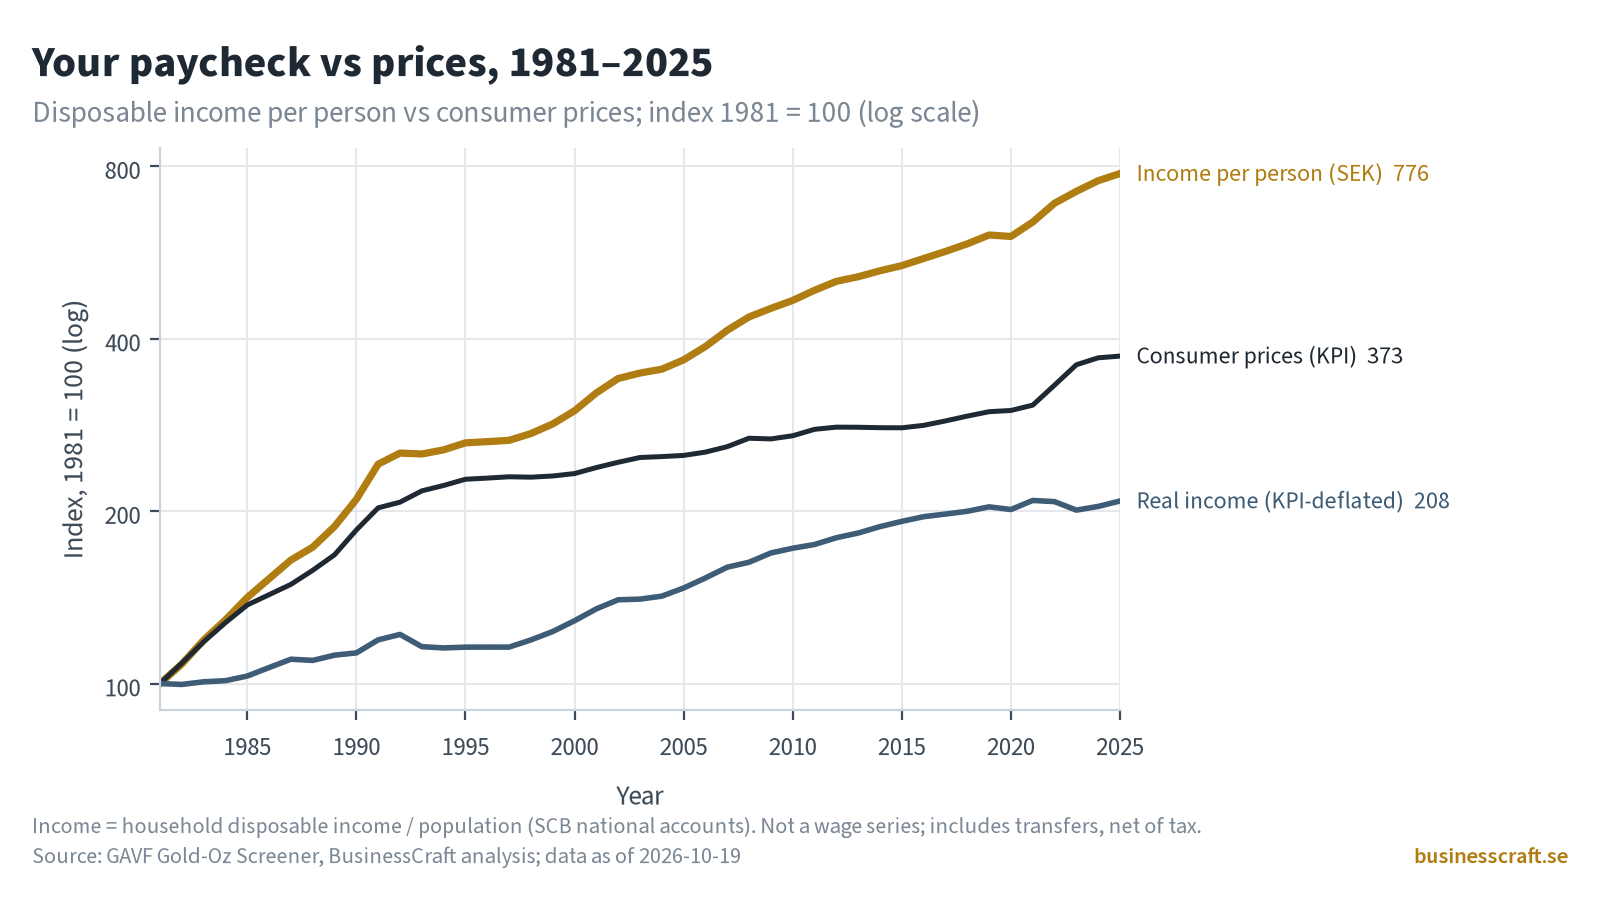
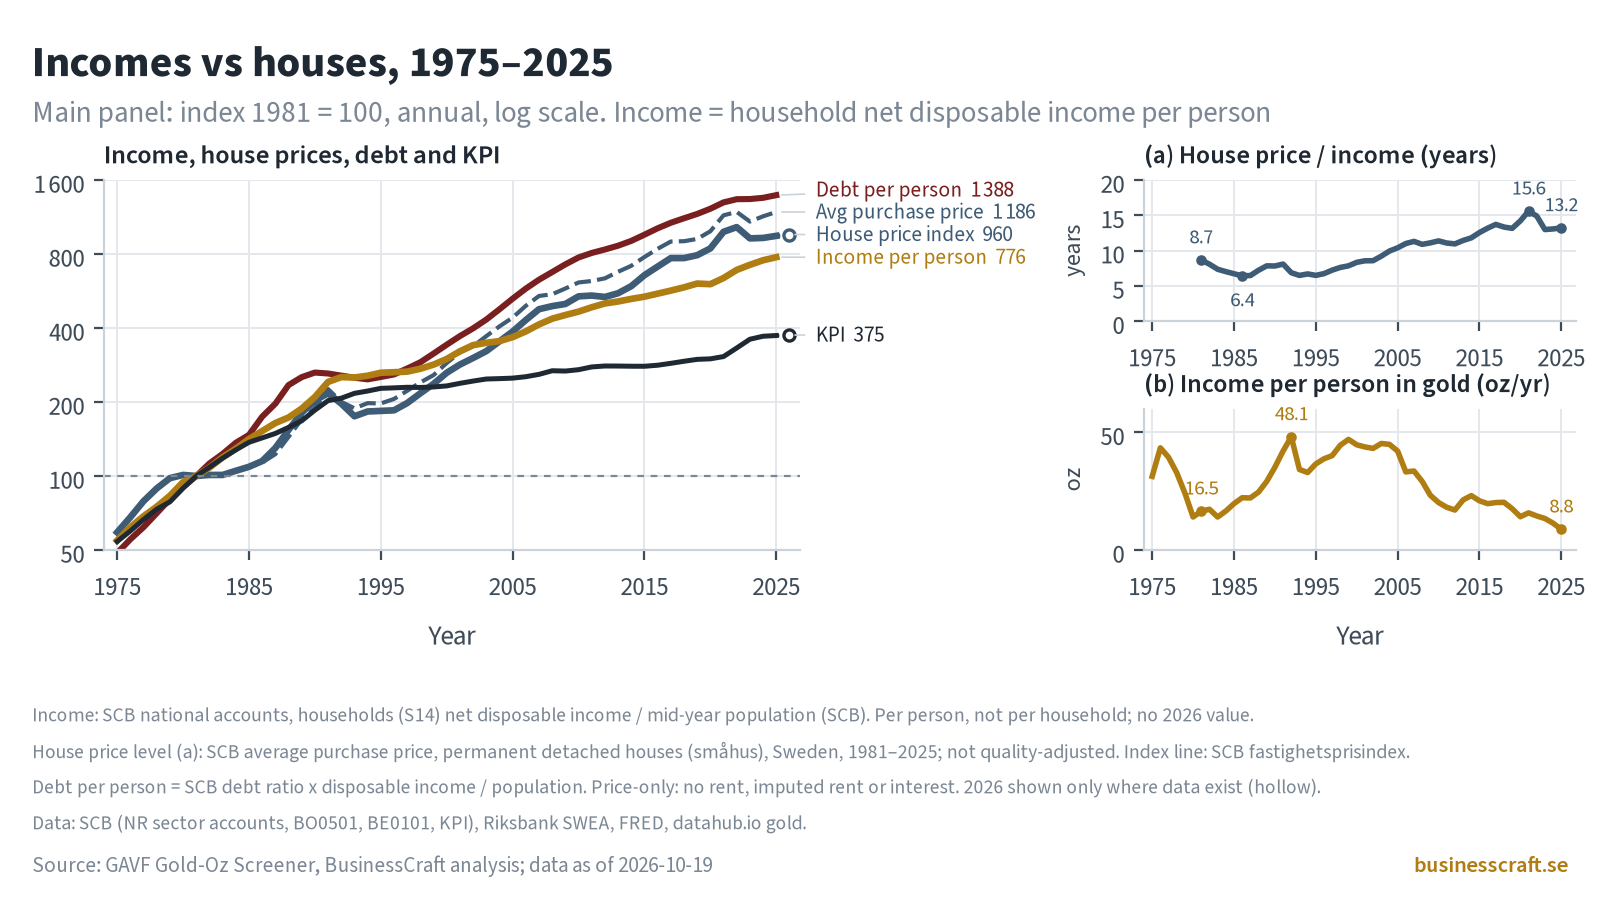
From 1981 to 2025, disposable income per person rose 7.8× (38,116 → 295,948 SEK). Over the same period the quality-adjusted house price index rose 9.5×, the average purchase price of a house rose 11.9× (330,000 → 3,913,000 SEK), household debt per person rose 13.9× (37,037 → 514,220 SEK) and KPI rose 3.7×. In real terms (deflated by KPI), income per person roughly doubled (×2.1) and the house price index rose 2.5×.
A house costs more years of income than in 1981
The average purchase price was 8.7 years of disposable income per person in 1981. It fell to a low of 6.4 in 1986 (6.5 in 1993), climbed to 10.9 by 2008 and peaked at 15.6 in 2021, then eased to 13.1 (2024) and 13.2 (2025). Because the average price is not quality-adjusted, part of the rise may reflect bigger or better houses being sold. The quality-adjusted index gives a smaller gap (×9.5 vs ×7.8).
Measured in gold, a year’s income per person buys about half as much as in 1981
It was 16.5 oz in 1981 and peaked at 48.1 oz in 1992, when gold was cheap in kronor. It was 44.7 oz in 2000, 18.1 oz in 2011, 14.1 oz in 2020 and 8.8 oz in 2025, the lowest in the series. The level depends heavily on the gold price, and 1980–81 were gold-price peak years.
What this means for the “homes are always safe” thesis
In kronor, house owners since 1981 have seen prices rise faster than incomes. But each step up has needed more years of income and more debt per person, so households carry more leverage relative to what they earn. Higher prices relative to income do not on their own say where prices go next. This is a description, not a forecast or a buy/sell signal.
Limits and caveats
Chart 4 caveats. Income is per person (including children), not per household or per earner. The house-price level in panel (a) is SCB’s average purchase price for permanent detached houses (småhus) in Sweden, which is not quality-adjusted. There is no 2026 income or average price; only the house index and KPI have 2026 partial values (hollow markers). Debt per person is derived (debt ratio × disposable income ÷ year-end population). No wage series is included, because disposable income is the primary measure and no consistent free wage series back to 1981 was available without splicing.
Limits. All series are index numbers on a 1981 base. 1980–81 were gold-price peak years, which flatters “in gold” declines, and a different base year would change the levels, though not the ordering of growth. The data is annual. M3 is a year-end stock while the others are annual averages. 2026 is partial (houses Q1–Q2, KPI and gold Jan–Sep, M3 Aug), and GDP and debt end in 2025. Everything is price-only: no rent, imputed rent, dividends or interest are included, so this is not a total-return comparison between housing, shares and gold. M3 joins two definitions at 1999. Household debt is derived (ratio × income) and cross-checks within 0.05% of the financial accounts. Nothing here is investment advice or a buy/sell signal.
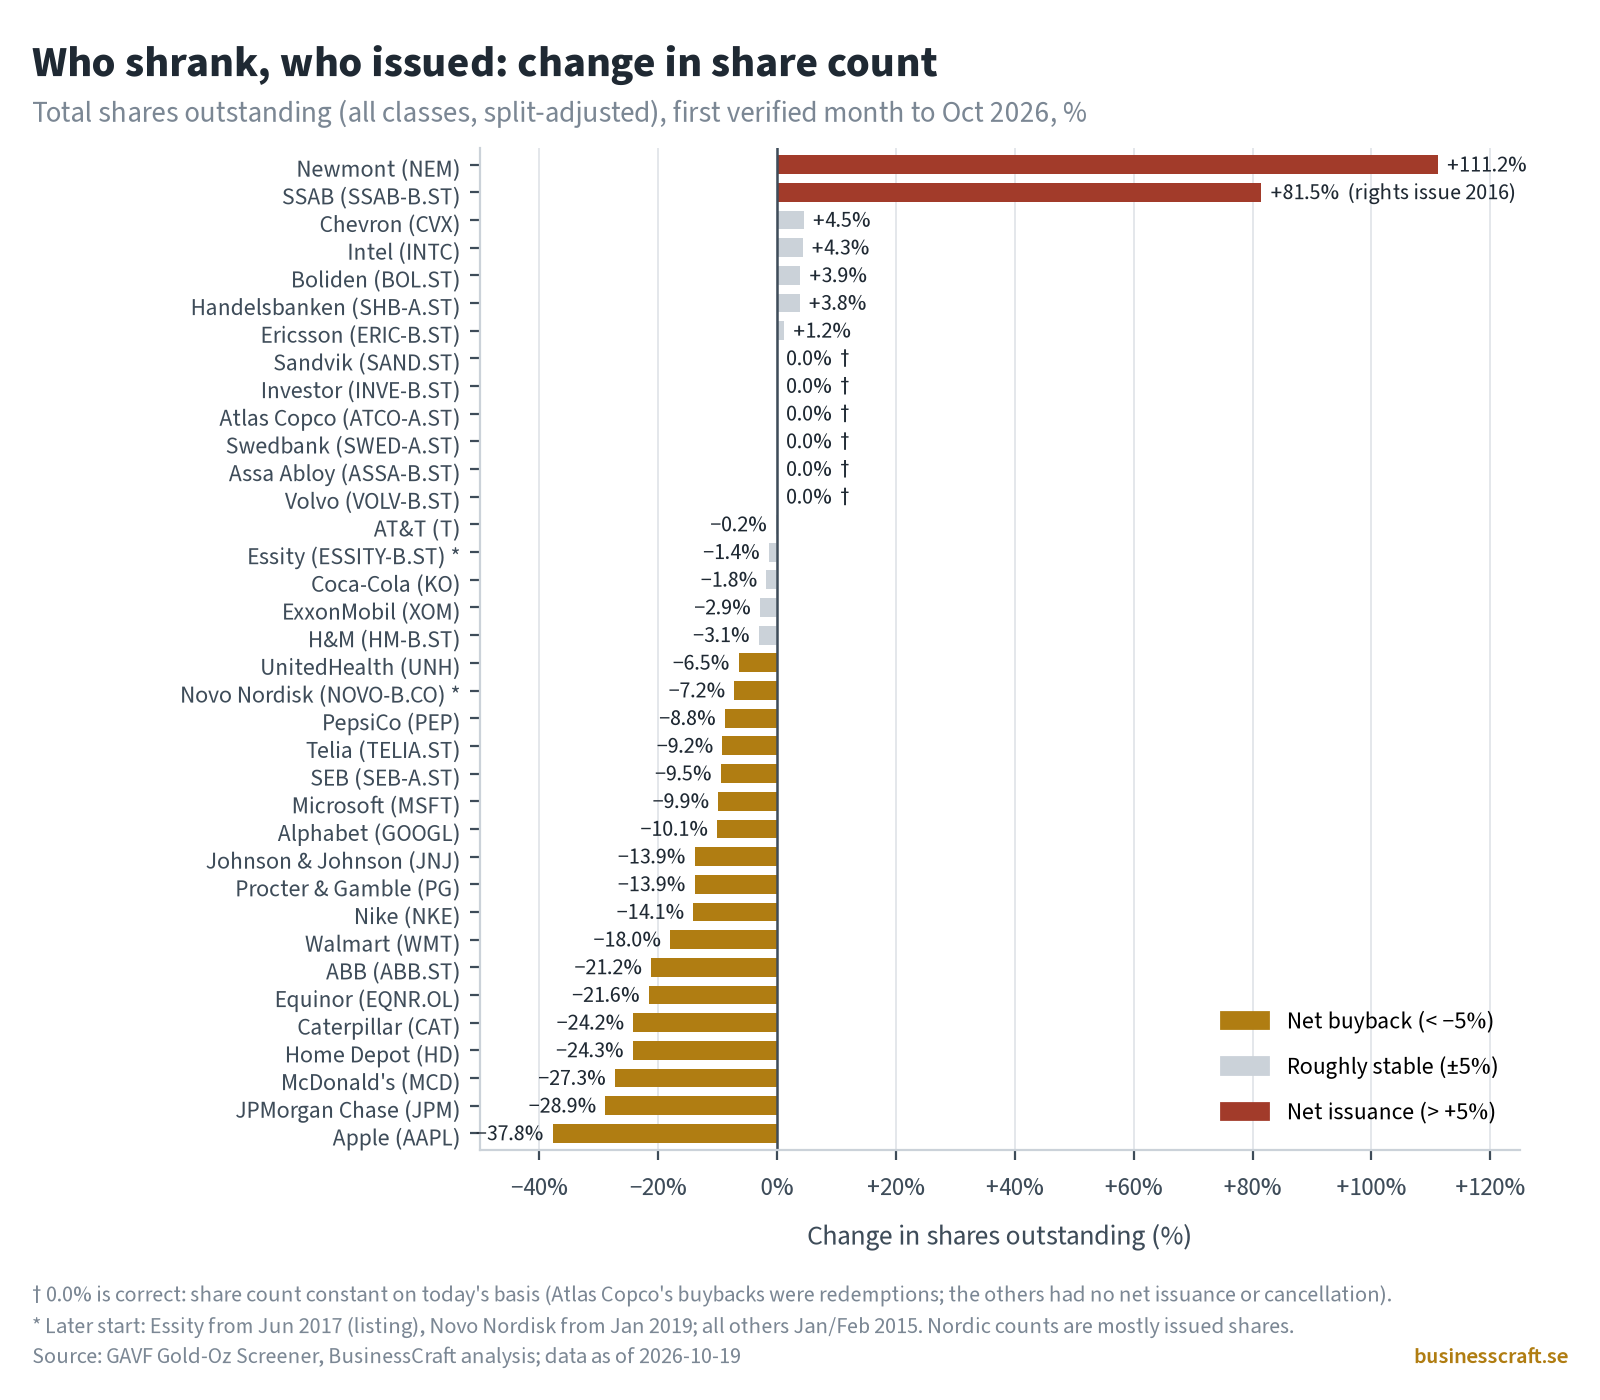
Related reading: the evolution of money from Bretton Woods to fiat, the debt reckoning, global gold mining leaders 2025 and who really shrank? Buybacks measured in gold.