Educational analysis, not investment advice. No trading signals; the charts show co-movement, not cause and effect.
Läs på svenska: Vart tog kronan vägen? Penningmängd, ränta, KPI och villor
Swedish inflation came in on the low side in October. SCB’s flash estimate put KPIF at 1.1% and KPI at 0.9%, published the day after the Riksbank raised its policy rate to 2.00% (applied from 11 November).¹ That raises a fair question. The Swedish money stock is several times larger than it was two decades ago, so why is consumer inflation so low? The short answer from the data is that most of the extra money has travelled alongside credit and house prices, and the CPI is not built to measure asset prices. The charts below walk through that story step by step.
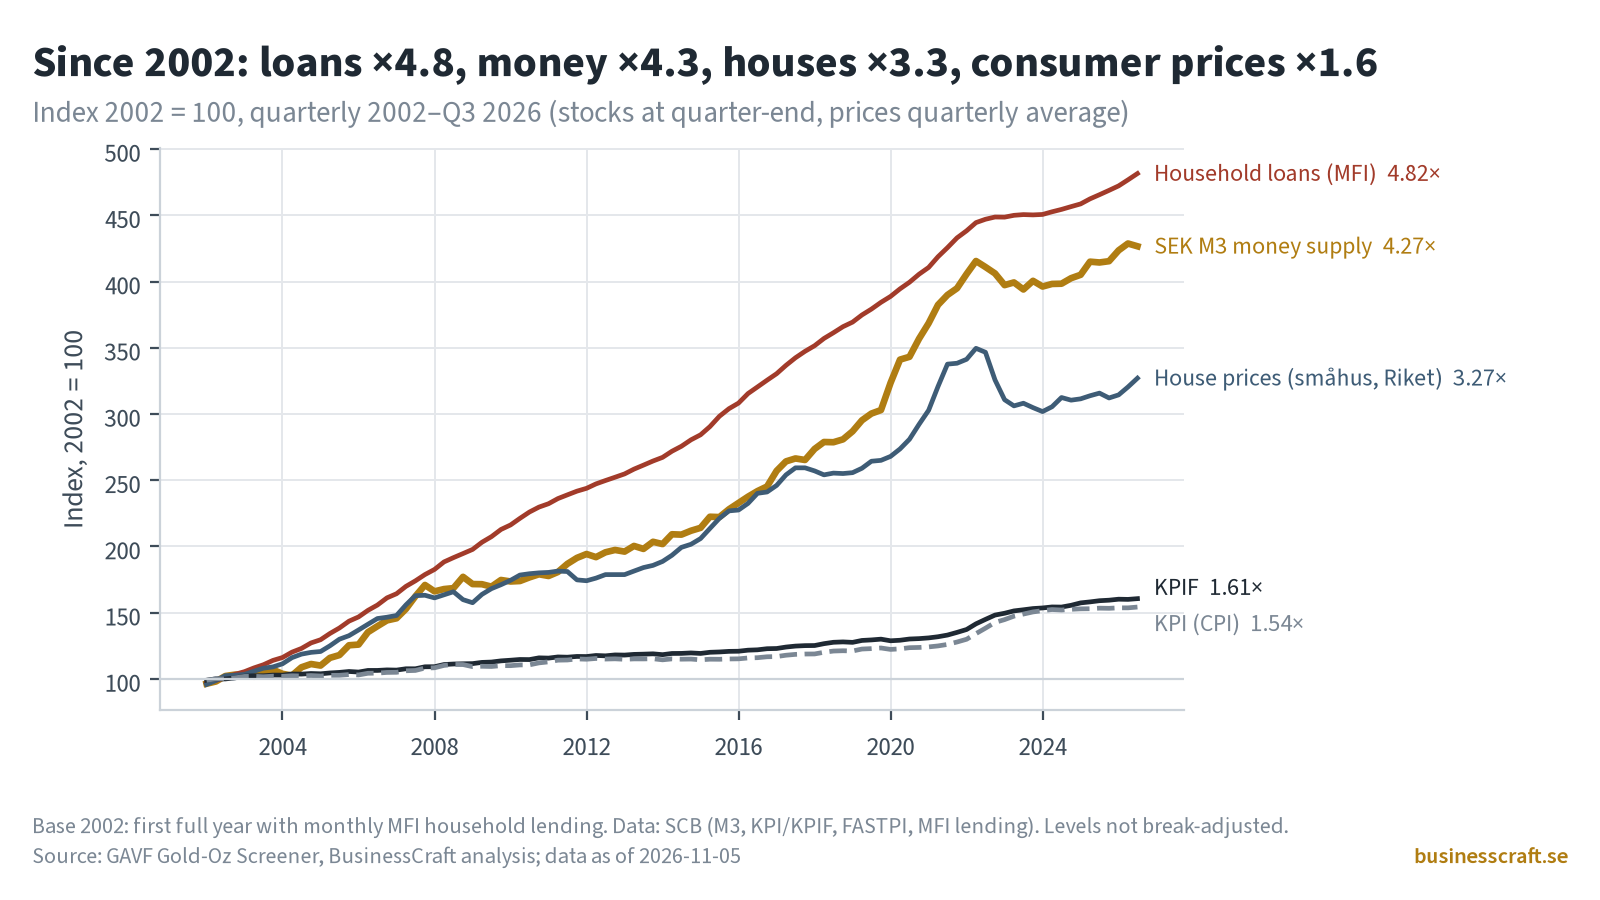
1. Four measuring sticks (Chart 1)
Start with the long view. From 2002 to Q3 2026, household loans from Swedish lenders grew 4.8×, the M3 money stock 4.3× and house prices (SCB småhus index, whole country) 3.3×. The KPIF consumer basket rose only 1.6× (KPI 1.5×). Annual data from 1999 to 2025 tell the same story: M3 ×4.6, household loans ×5.3, house prices ×4.0 and KPI ×1.6.
Money, loans and houses moved together. Consumer prices were left well behind.
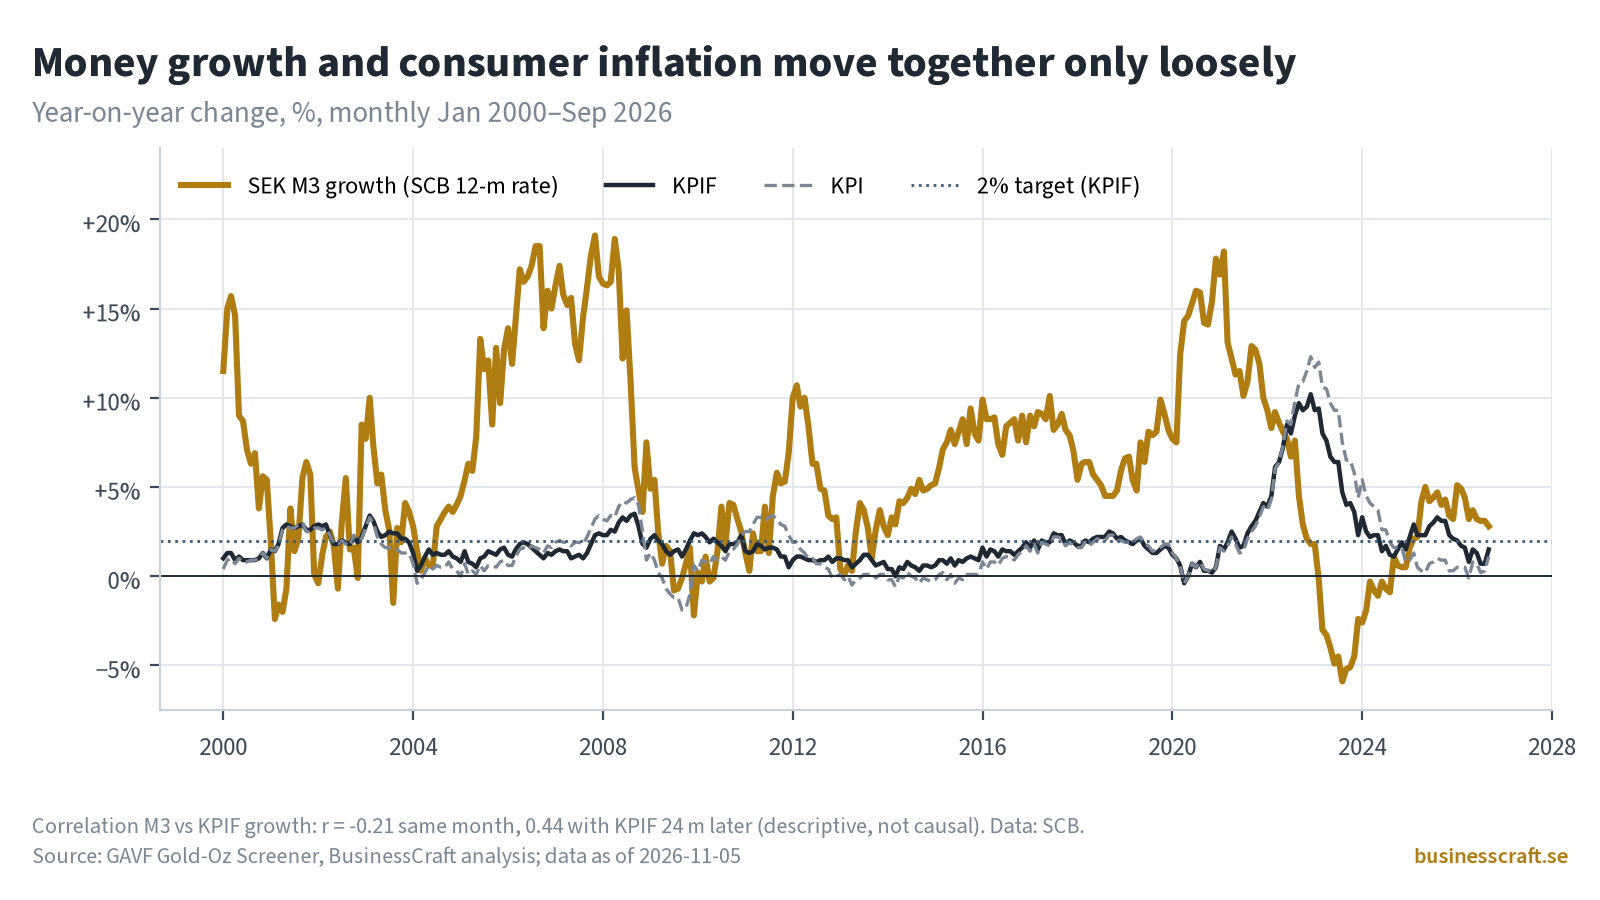
2. Money growth and CPI are only loosely linked (Chart 2)
The year-on-year growth rates show the same gap. M3 growth peaked at 18% in early 2021 and fell to −6% in August 2023, while KPIF inflation peaked at 10.2% in December 2022. Over 2000–2026, the same-month correlation between M3 growth and KPIF inflation is slightly negative (r = −0.21). With KPIF shifted 24 months later, it rises to +0.44. House-price growth tracks M3 growth more closely, within the same quarter (r = +0.54). These figures describe the past; they are not a forecasting rule.
Why houses don’t show up in KPI
Part of the gap comes down to how the index is built. SCB does not price houses as a KPI item, because a home purchase is mostly an asset (including land) changing hands between households. Owner-occupied housing enters instead as a user cost: an interest-rate index multiplied by a capital-stock index, and the capital-stock index is in practice a long moving average of house prices. KPIF, the Riksbank’s target measure, holds the interest-rate part fixed. A house-price boom therefore reaches KPIF only slowly and in diluted form. That is why “inflation is low” and “homes got much more expensive” can both be true at the same time.
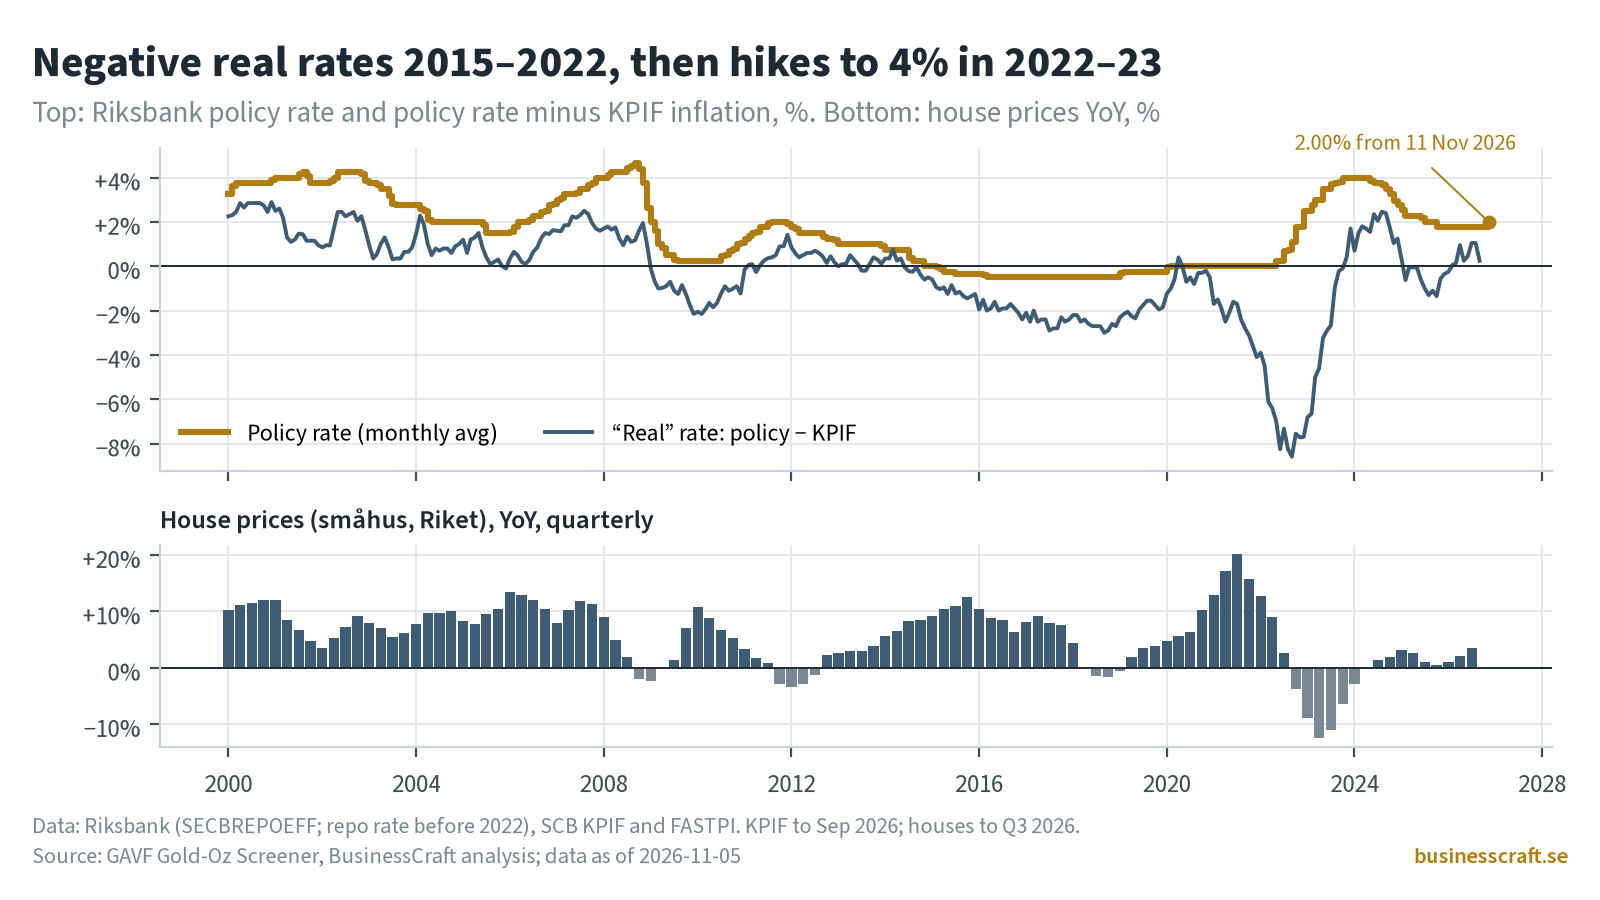
3. Rates: negative real rates, then a sharp turn (Chart 3)
Interest rates are the other half of the housing story. The policy rate stood at −0.50% in 2016–2019, and the policy rate minus KPIF reached about −8.6 percentage points in September 2022. The hikes to 4.00% in 2023 coincided with house prices falling 12% year on year (Q2 2023). Cuts down to 1.75% followed, and now a hike to 2.00%. In September 2026 this “real” rate was about +0.25 percentage points, and house prices were up 3.6% year on year in Q3.
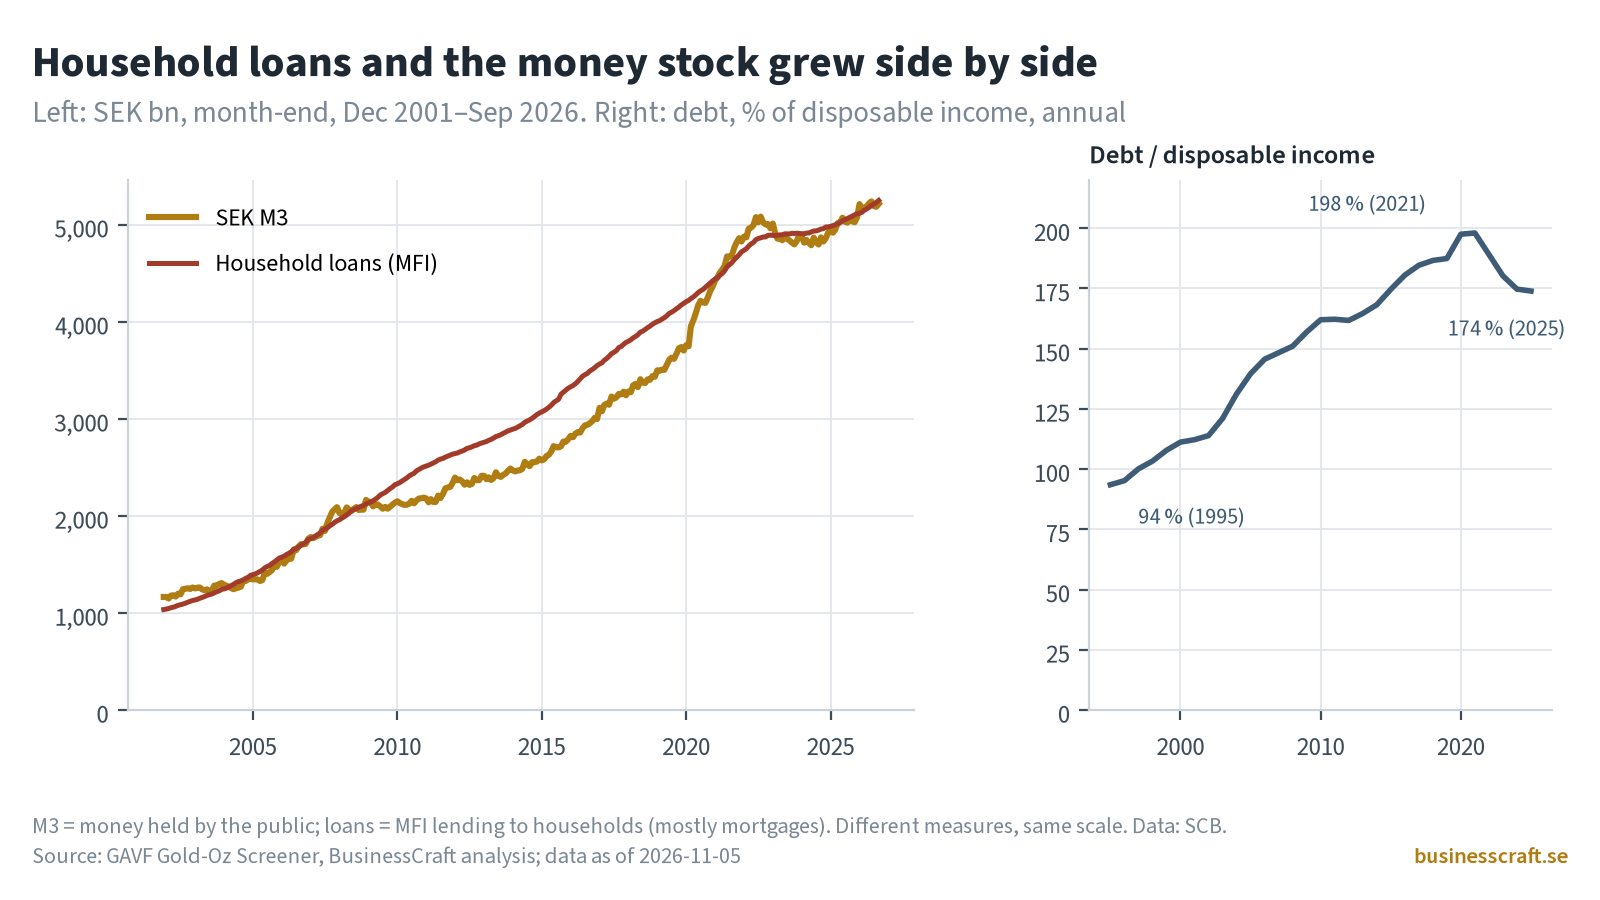
4. Where the money stock grew (Chart 4)
Why do money and credit track each other so closely? M3 and household loans are different measures, yet both stood at about SEK 5.2 trillion in September 2026, and they have grown side by side for two decades. When banks lend, they create deposits, so credit and broad money tend to move together. Household debt rose from 94% of disposable income in 1995 to 198% in 2021, then eased to 174% in 2025.
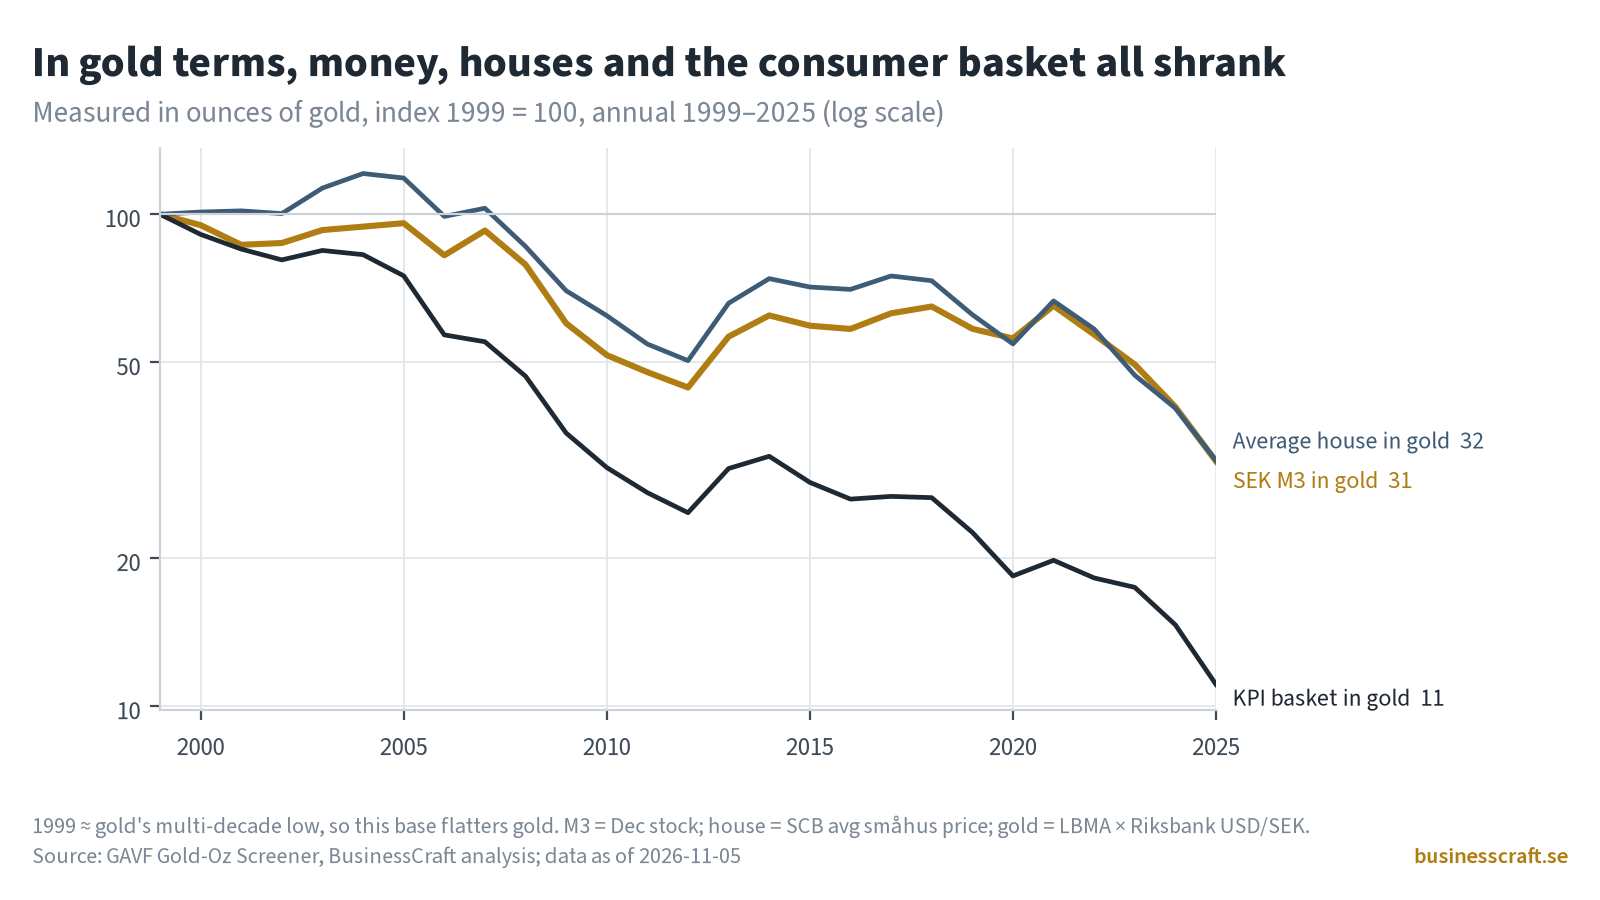
5. Measured in gold, everything shrank (Charts 5 and 6)
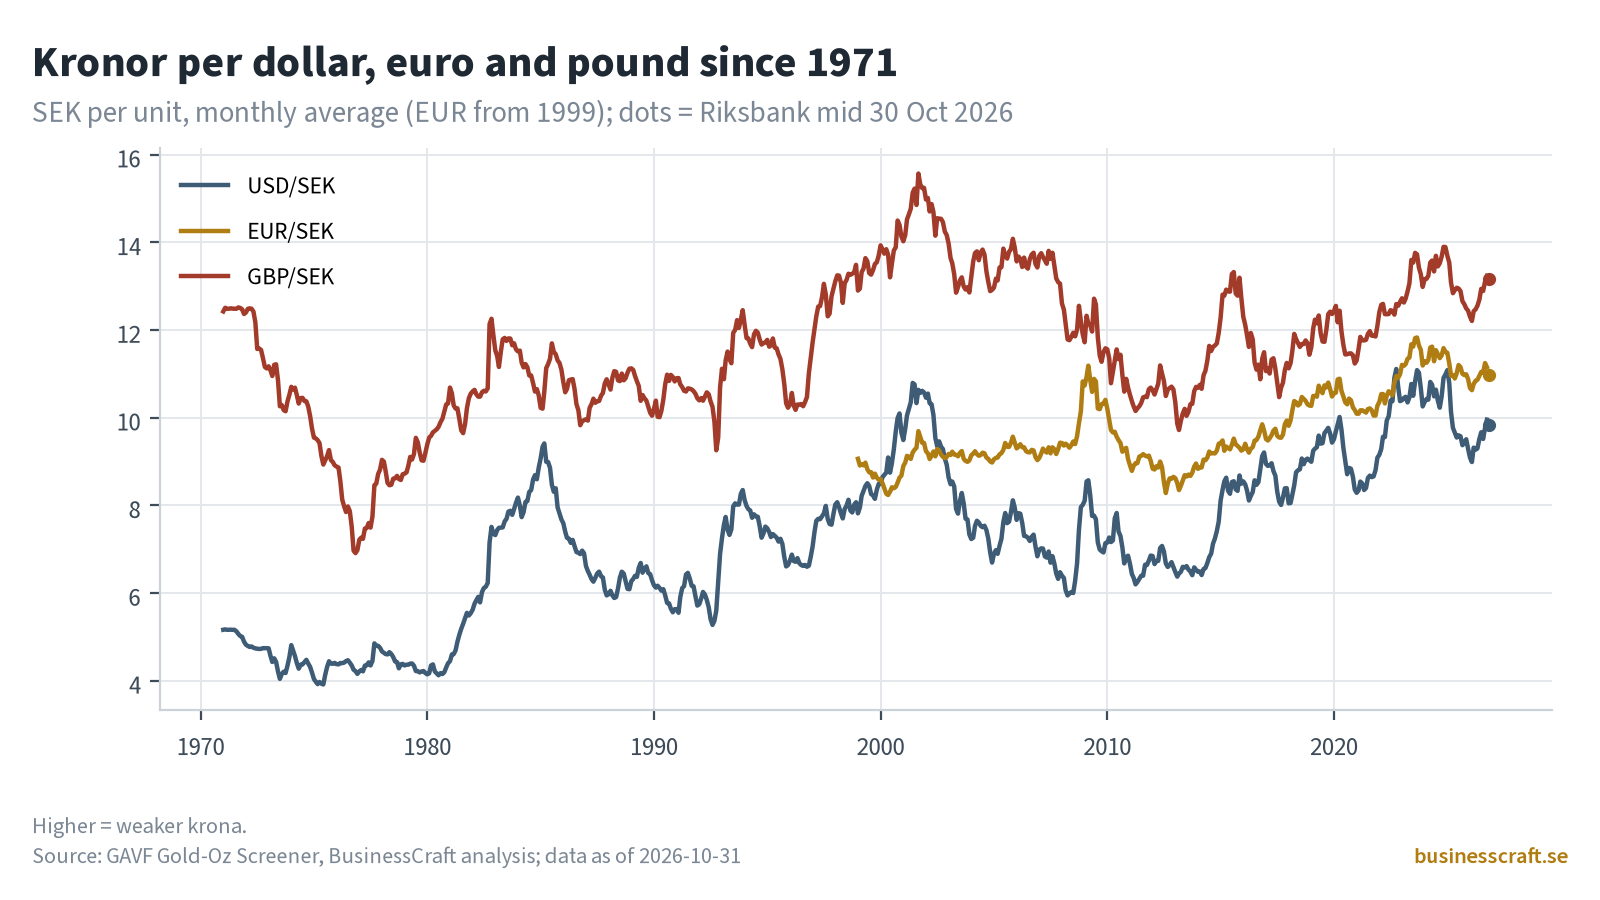
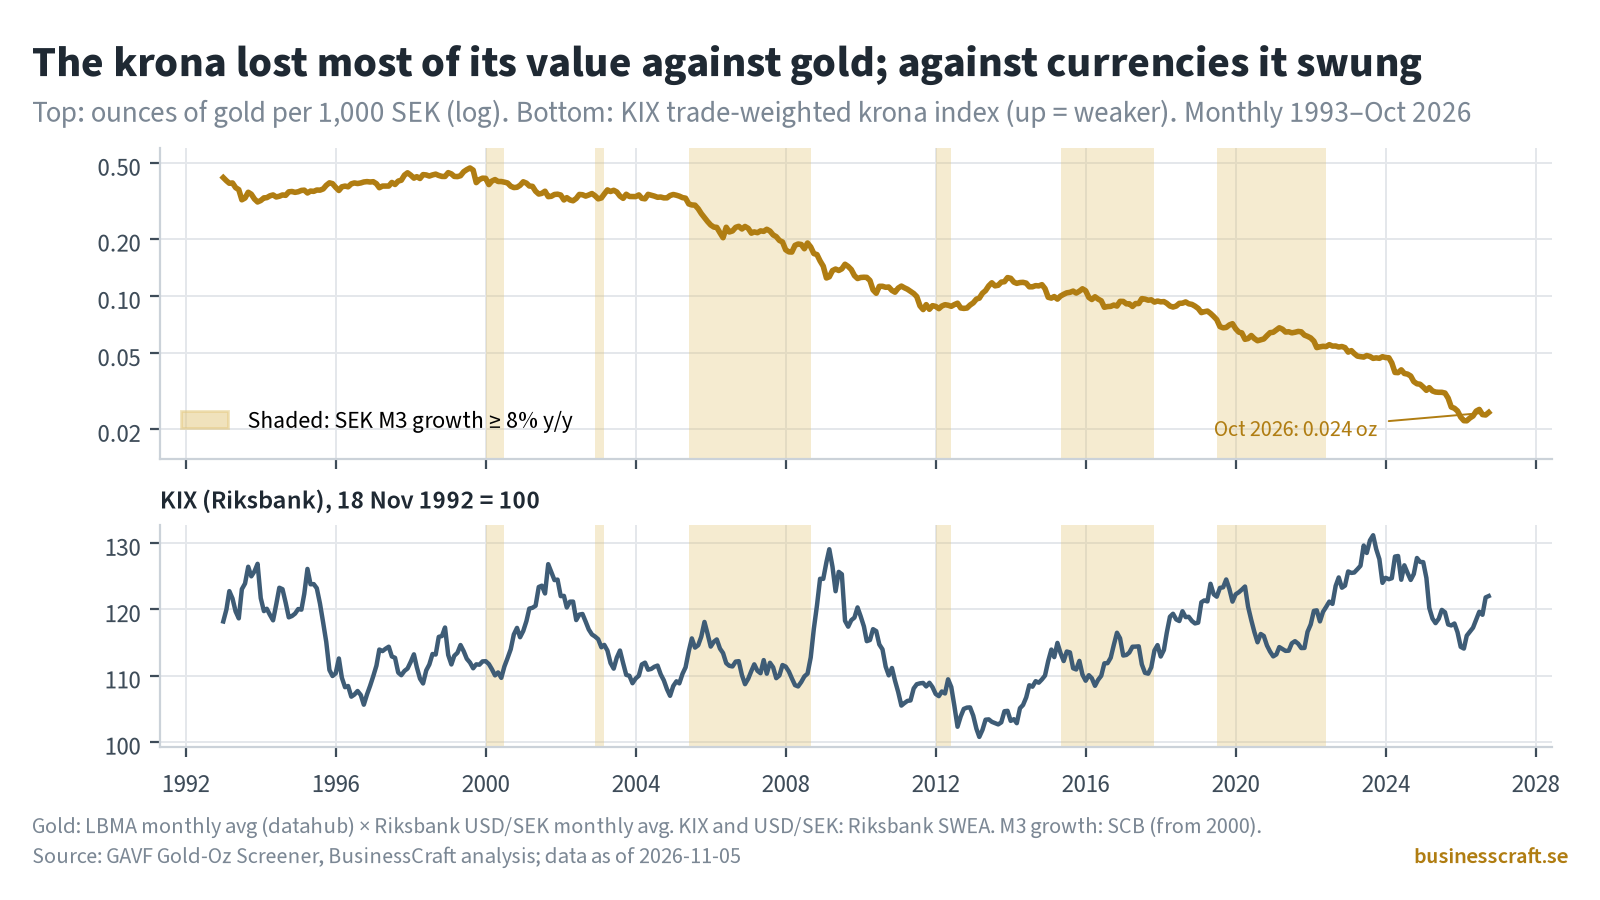
Changing the measuring stick changes the picture. Measured in gold, both SEK M3 and the average house are worth about 0.32× their 1999 value, and the KPI basket about 0.11×. In 1999, 1,000 kronor bought 0.44 oz of gold; in October 2026 it bought 0.024 oz, a fall of 94%. Against other currencies, the krona swung rather than trended (KIX 113 in 2000, 131 at the 2023 weak point, 122 in October 2026). One caveat: 1999 was close to a gold low, so that base year flatters gold. This is the same pattern we saw in post-05 (paycheck vs houses and gold) and post-08 (money stocks in gold).
6. From QE to QT: visible on the balance sheet (Chart 7)
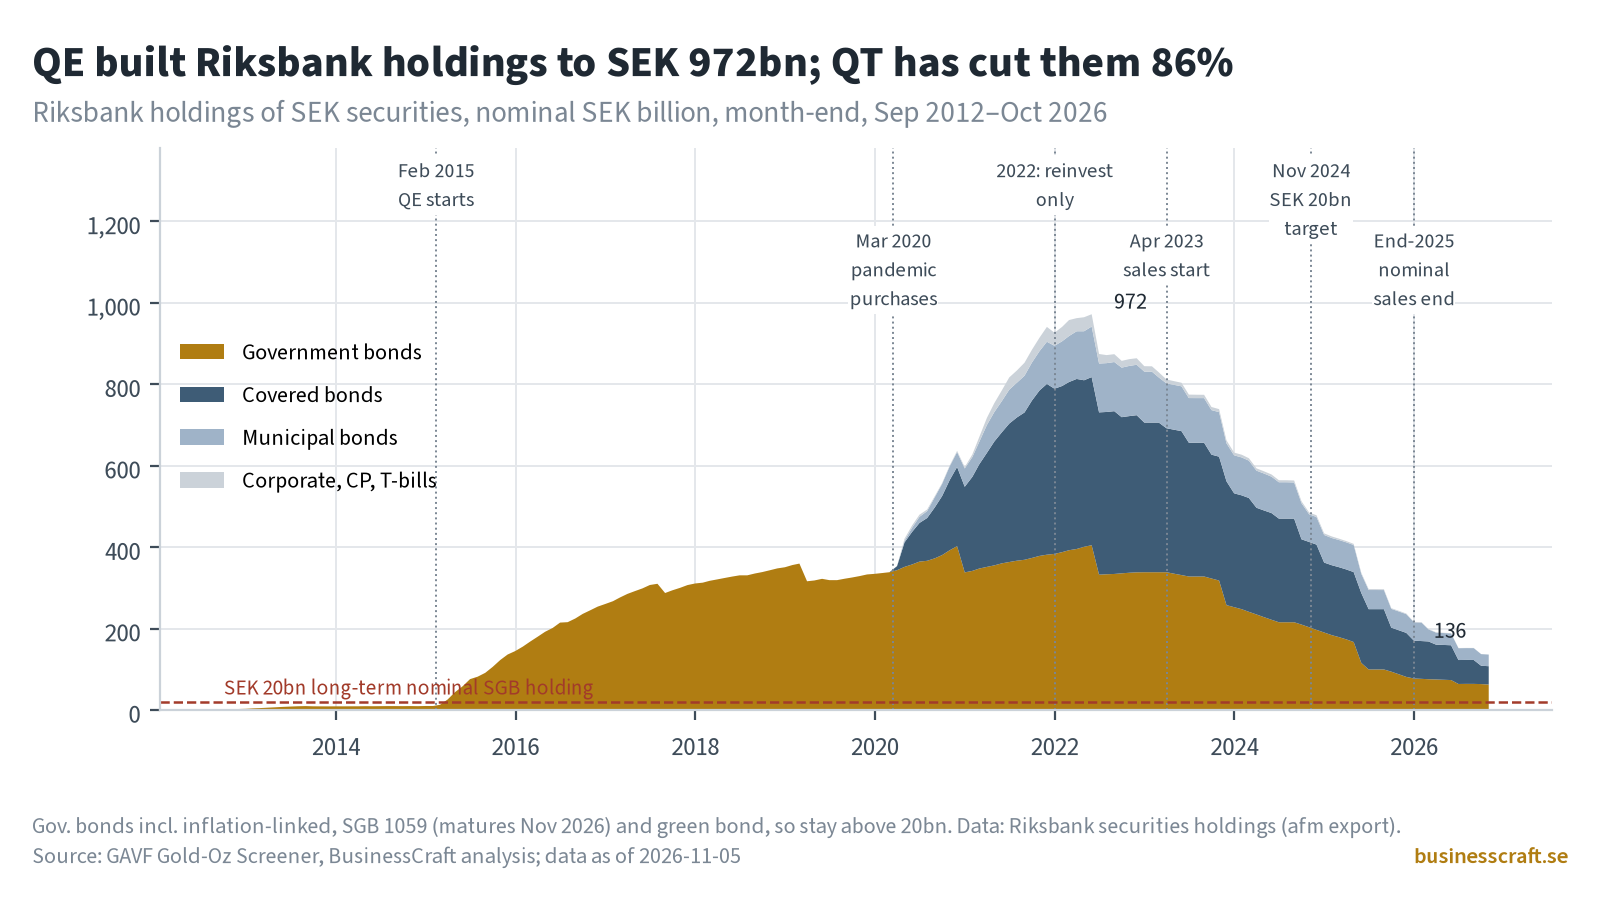
Finally, the Riksbank’s own balance sheet. The Riksbank began buying government bonds in February 2015 and widened its purchases from March 2020 (a SEK 700bn envelope running to end-2021). In 2022 it only replaced maturing bonds, and from 2023 it bought nothing. Its holdings of SEK securities peaked at SEK 972bn in May 2022. Sales of government bonds started in April 2023, with the pace raised in June 2023 and again in February 2024. In November 2024 the Riksbank set a long-term nominal holding of SEK 20bn. Nominal sales ended at end-2025, while sales of inflation-linked bonds continue in 2026. By October 2026, holdings had fallen to SEK 136bn (−86%). Government bonds made up SEK 62.5bn of that; the figure includes inflation-linked bonds, SGB 1059 and the green bond, which is why it sits above 20bn.
QT is obvious in the holdings but hard to see in the money stock: M3 was about 4% higher in September 2026 than in May 2022. A Riksbank analysis from May 2026 found limited effects on deposits and risk premia so far, because banks and leveraged investors such as hedge funds absorbed much of the supply.
Looking ahead: three scenarios for 2027–2029 (speculation)
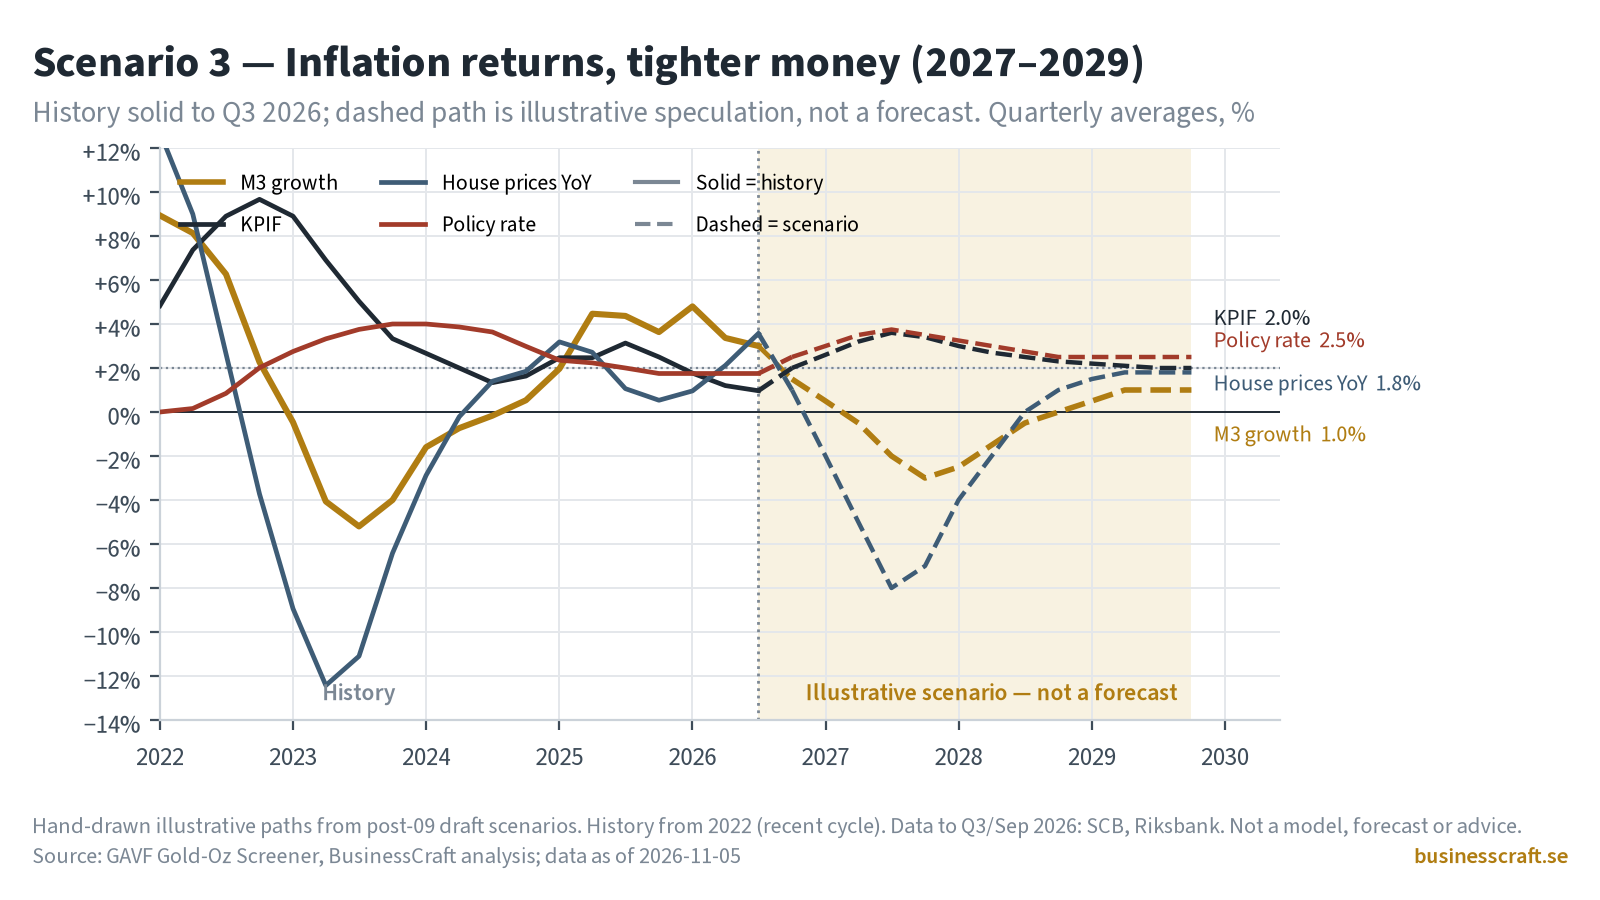
Speculation: illustrative scenarios, not forecasts, predictions or advice. Each one simply extends a pattern already visible in the charts above, and reality may follow none of them. Charts 8–10 draw the same three paths as dashed lines after Q3 2026 (hand-drawn stubs, not a model).
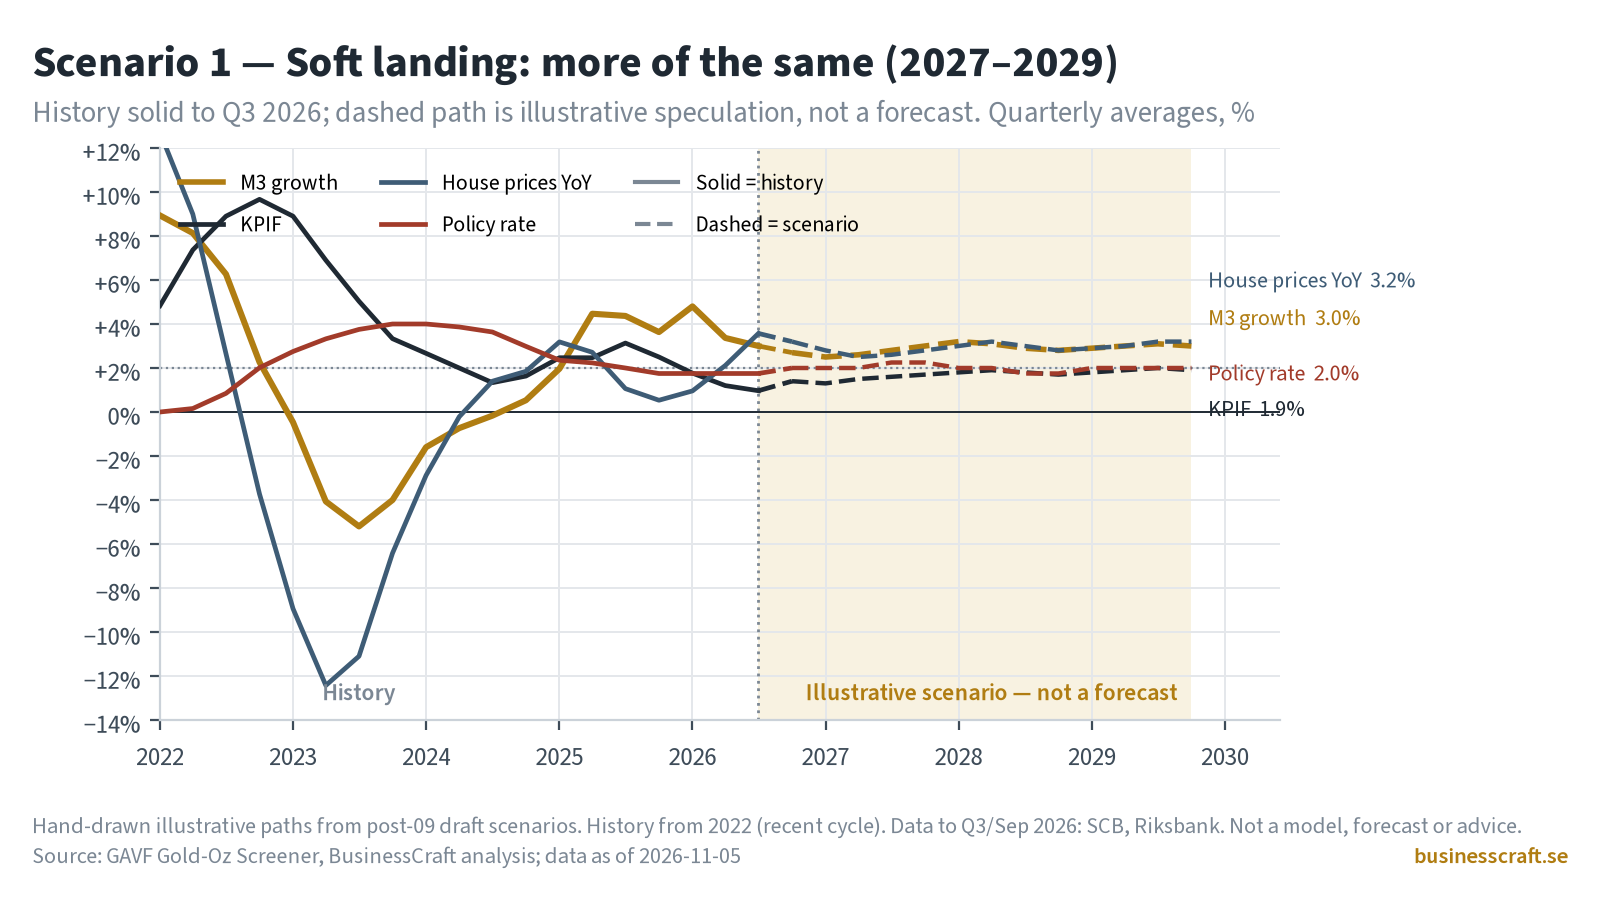
1. Soft landing, more of the same (Chart 8). Inflation stays low, the hike to 2.00% turns out to be a fine-tuning rather than the start of a new cycle, and money and credit grow roughly in line with incomes, much as in 2025–26.
- KPIF: around 1–2%
- M3 growth: low single digits (near today’s +2.8%)
- House prices: grinding upward, broadly in line with incomes
- Policy rate: roughly 1.75–2.5%; the remaining QT holdings (mainly inflation-linked bonds) shrink slowly
- Krona: still soft or flat in gold; KIX range-bound
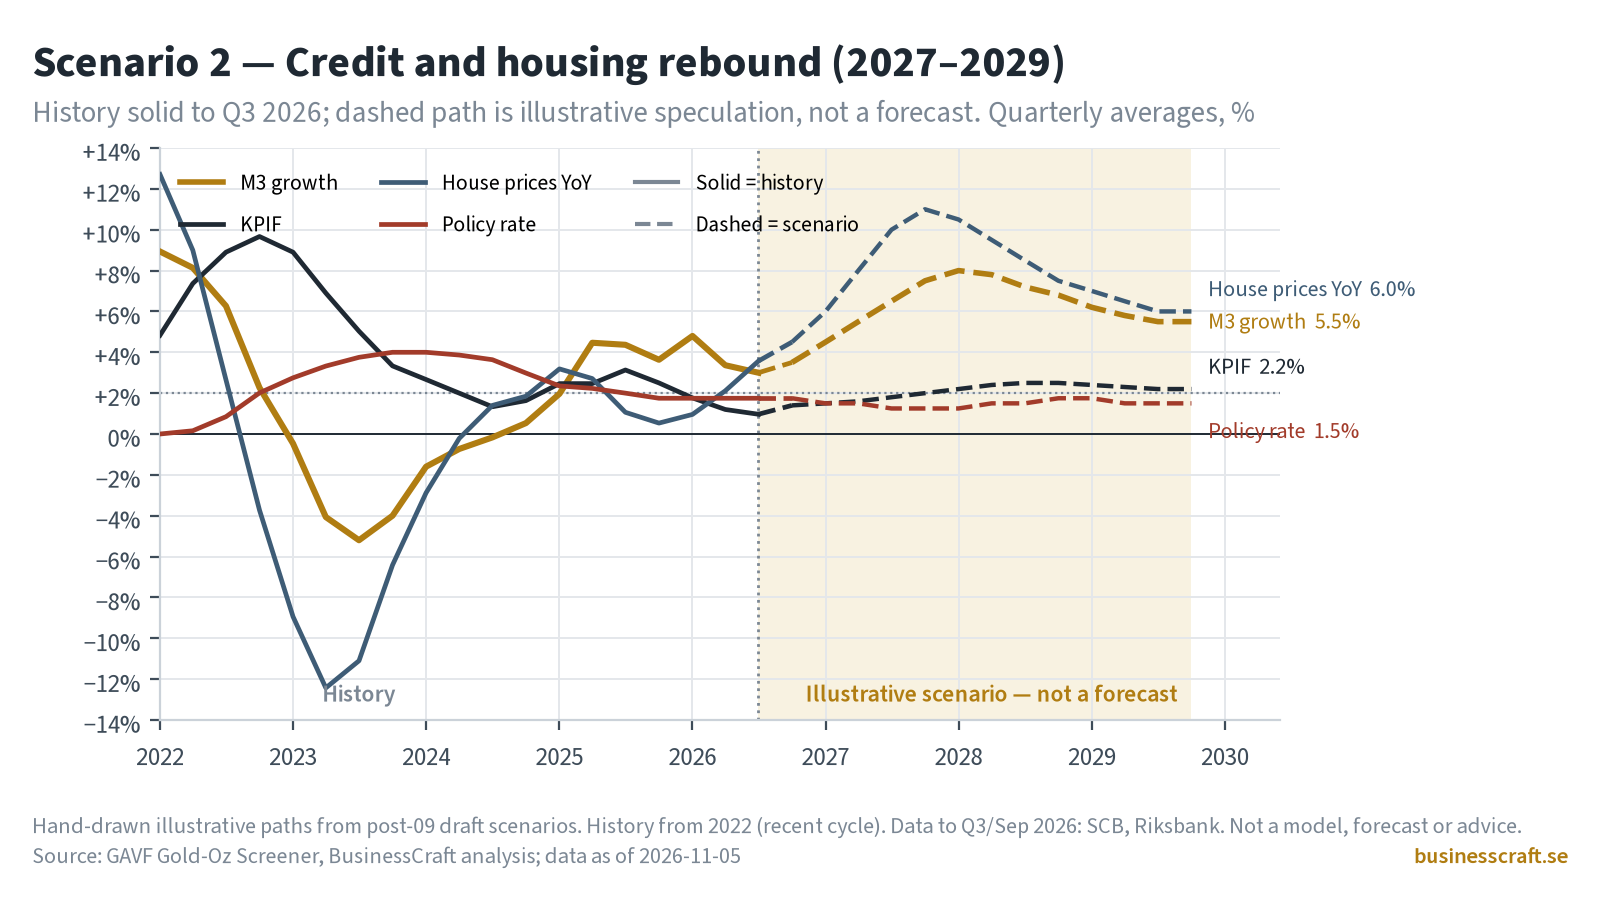
2. Credit and housing rebound (Chart 9). Rates ease again, or bank lending picks up speed. History suggests the extra money would show up first in loans and house prices (M3 vs house-price growth r = +0.54), with consumer prices following only slowly, if at all (r = +0.44 at a 24-month lag). Think of it as a smaller echo of 2015–21.
- KPIF: near or slightly above 2%, with a lag
- M3 growth: picks up towards mid-to-high single digits, alongside household loans
- House prices: rising clearly faster than KPIF; debt-to-income drifts back up from 174%
- Policy rate: lower; the real rate close to zero or negative again
- Krona: weaker in gold as the SEK money stock grows
3. Renewed inflation, tight money (Chart 10). An energy or krona shock, or temporary fiscal measures rolling off, pushes KPIF back above target and the Riksbank keeps hiking. This follows the 2022–23 pattern: real rates jump, house prices stall, and M3 growth turns weak or negative (it reached −5.9% in August 2023).
- KPIF: back above 2%
- M3 growth: near zero or negative year on year
- House prices: flat to falling (they fell 12.4% y/y at the 2023 low)
- Policy rate: above 2.00%; QT itself is mostly done, so tightening runs through rates rather than the balance sheet
- Krona: KIX could swing either way; in gold, the long trend has rarely reversed
Whichever path Sweden takes, the record so far suggests that bank credit matters more for M3 than the Riksbank’s balance sheet (QT) does, and that money growth shows up first in housing, not in KPI.
What this does and does not say
In Sweden, more money has gone hand in hand with more household credit and higher house prices, much more than with faster CPI inflation. That is co-movement, not proof of cause, and it is not a forecast. The near-term swing factors that the Riksbank and economists point to are energy prices, temporary fiscal measures dropping out, and the krona.
¹ The October figures above are SCB flash estimates. SCB publishes the definitive October CPI on 12 November 2026; this post will be updated then.
Source: BusinessCraft analysis of SCB (M3, KPI, KPIF, FASTPI, MFI lending, financial accounts), Riksbank (policy rate, FX, KIX, securities holdings) and LBMA gold via datahub.io; data frozen 2026-11-05. Educational analysis, not investment advice.