Ask a Swede whether their pay goes as far as it used to and most will say no. The data give a more precise answer: it depends on what you measure the paycheck against. Against ordinary consumer prices, the average Swede’s income buys more than it did in 1981. The sense that it buys less comes from two other places: houses, and the krona measured in gold.
A note on “paycheck” first. There is no consistent Swedish wage series that reaches back to 1981 without splicing older series across method breaks. So we use household disposable income per person as the proxy. It is after tax and includes transfers such as pensions and benefits. It is not the same thing as a salary, and we say so throughout.
1. Consumer prices: the paycheck buys more
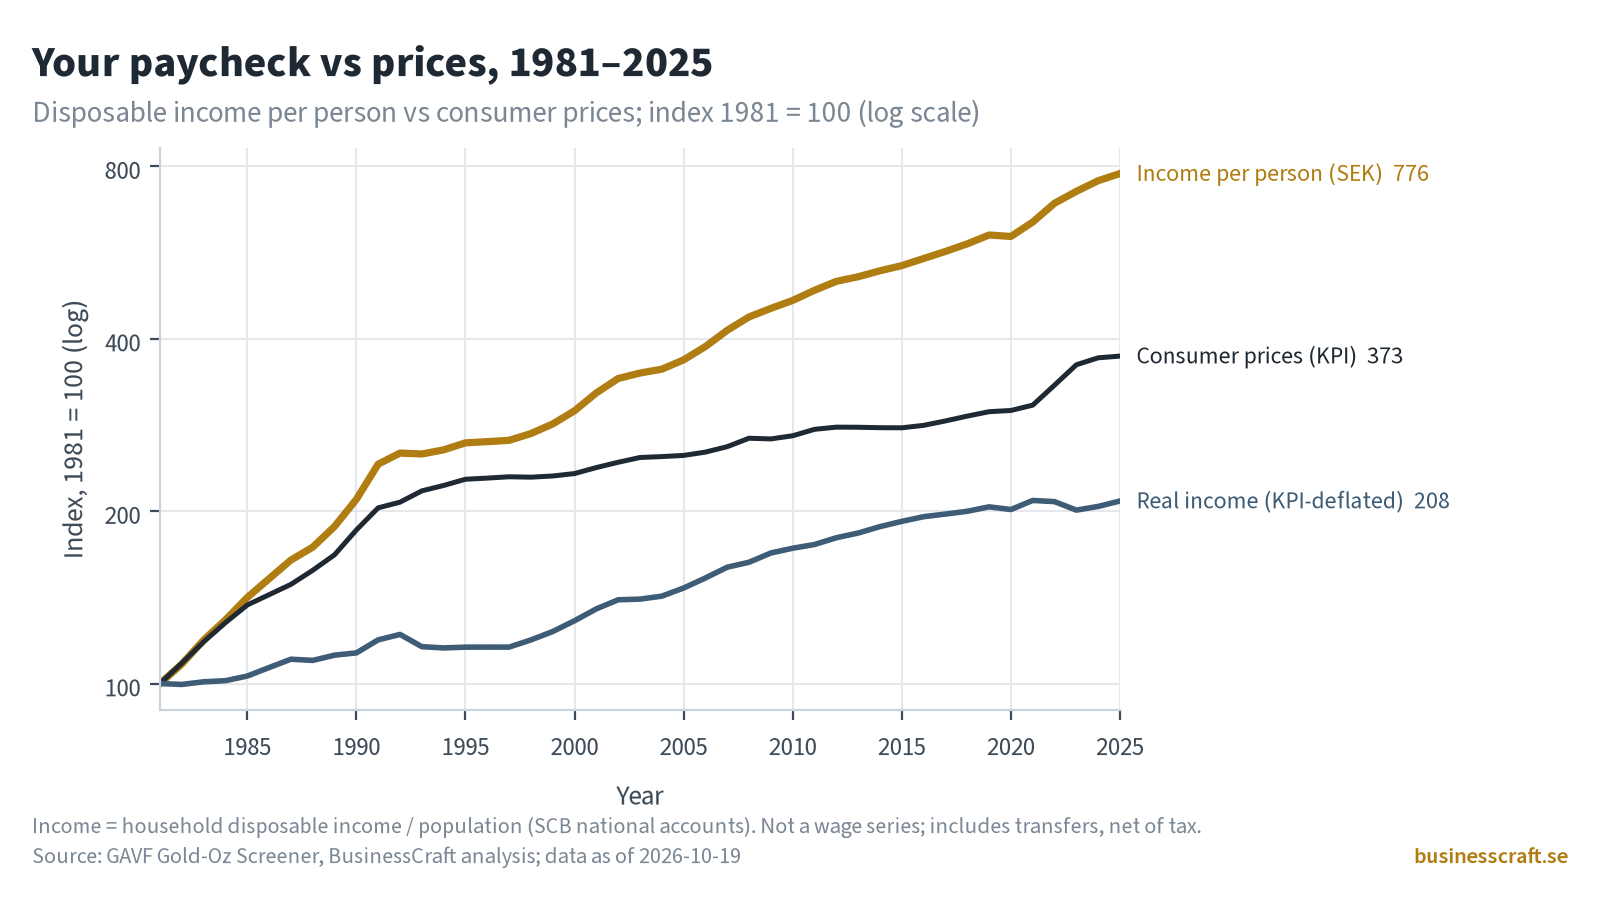
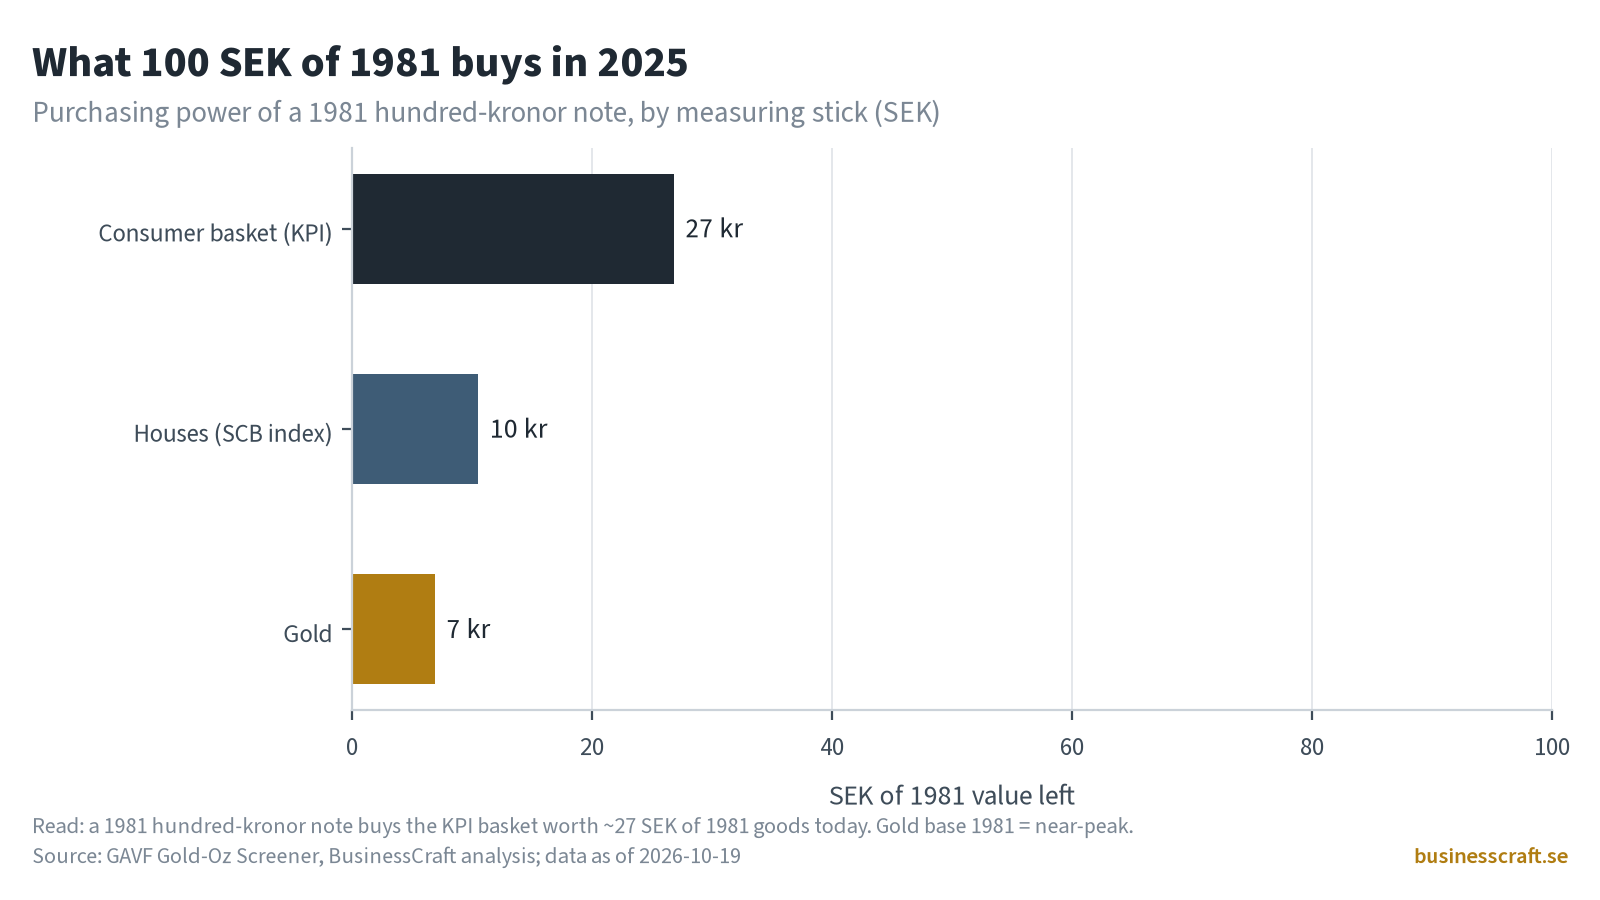
Since 1981 the consumer price index (KPI) has risen 3.7 times. A 100-kronor note from 1981 now buys roughly what 27 kronor bought then. That is ordinary inflation, and it is the version of “the krona buys less” most people have in mind.
But income rose faster. Disposable income per person went from 38,116 SEK in 1981 to 295,948 SEK in 2025, a 7.8-fold increase. Adjusted for KPI, that is a rise of about 108%: the average person’s real income roughly doubled. Measured against groceries, clothes and services, the typical paycheck goes further today than it did in 1981 (Chart 1).
2. Houses: the paycheck has lost ground
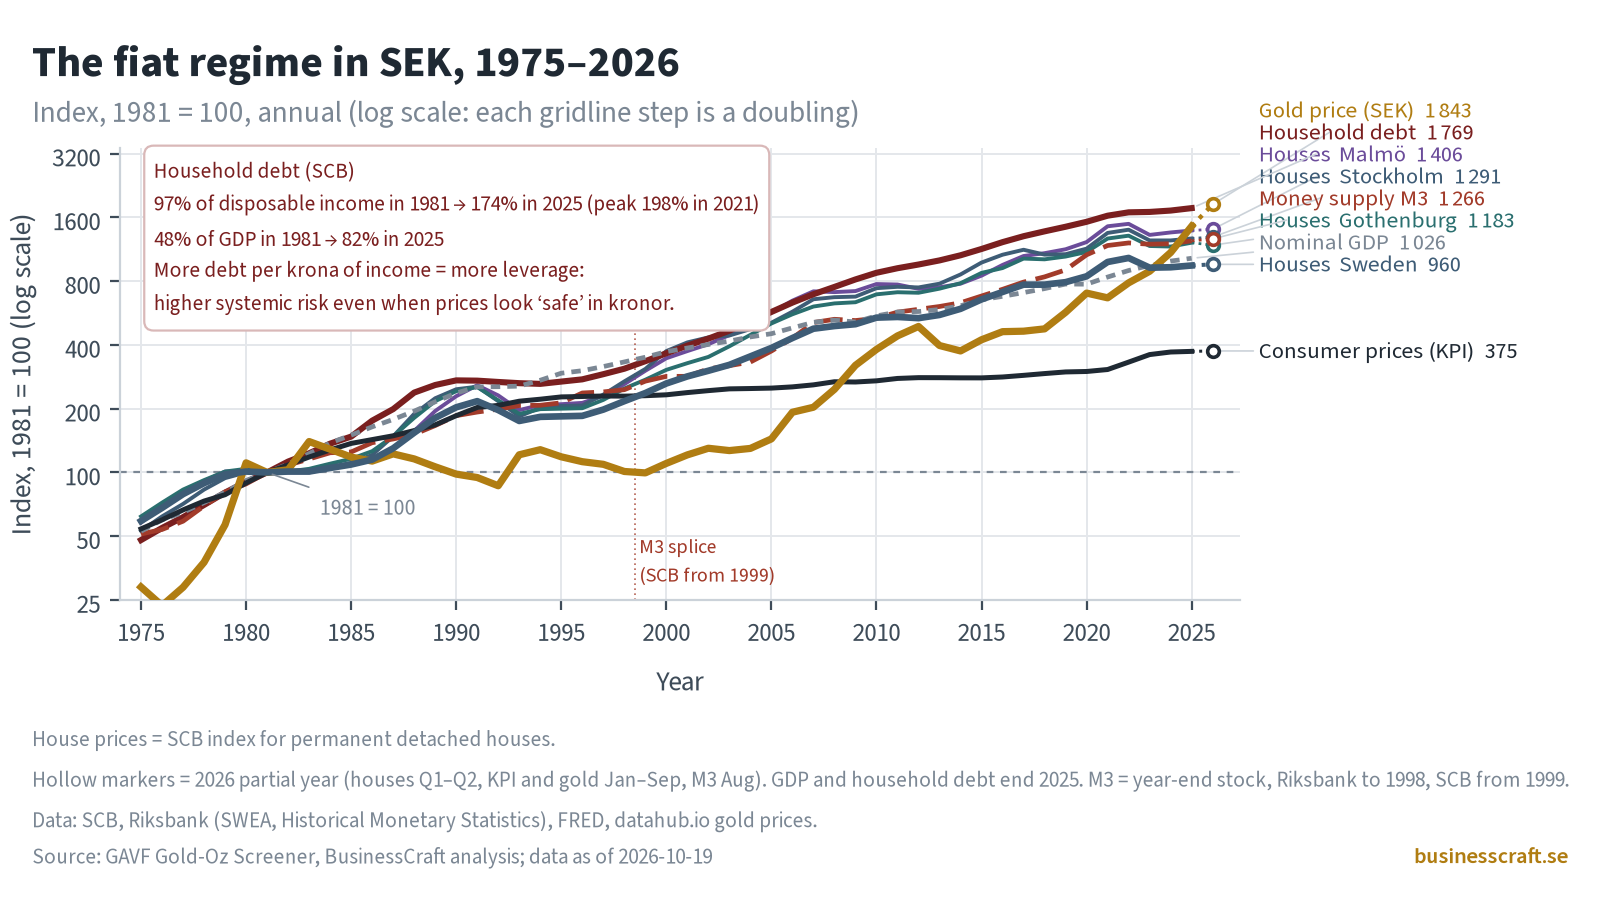
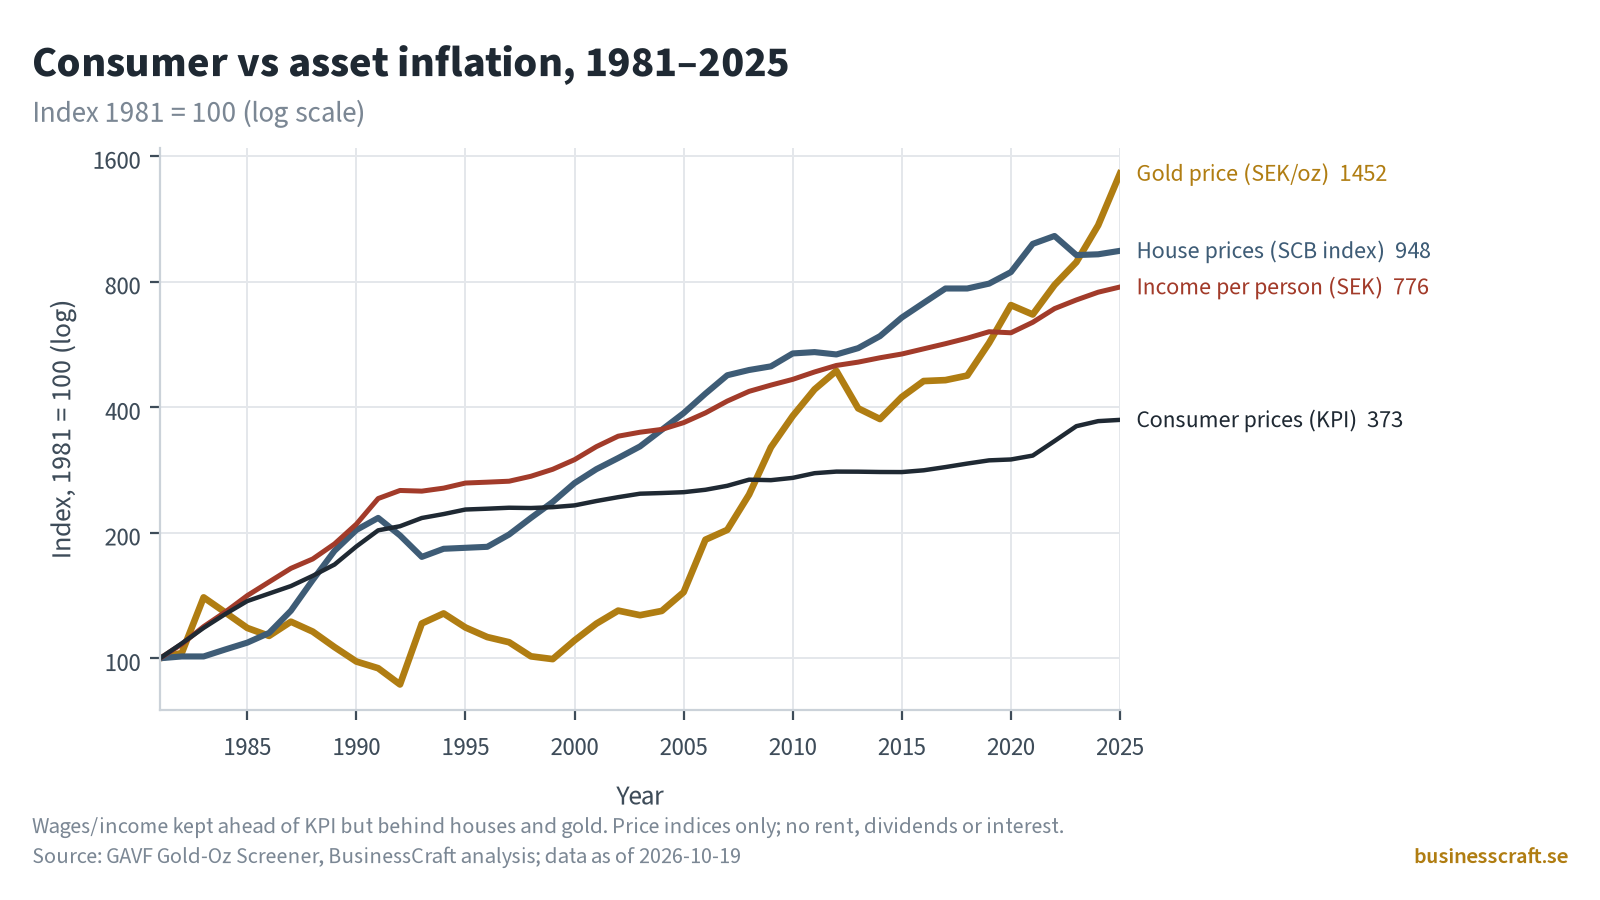
Asset prices tell a different story. SCB’s house price index for permanently occupied detached houses rose 9.5 times, faster than income. An average detached house cost about 8.7 years of disposable income per person in 1981 and about 13.2 years in 2025 (Chart 4). In house terms, 100 SEK of 1981 is worth about 10 SEK today. For the purchase most households care about most, pay has fallen behind.
3. Gold: the krona’s own measuring stick
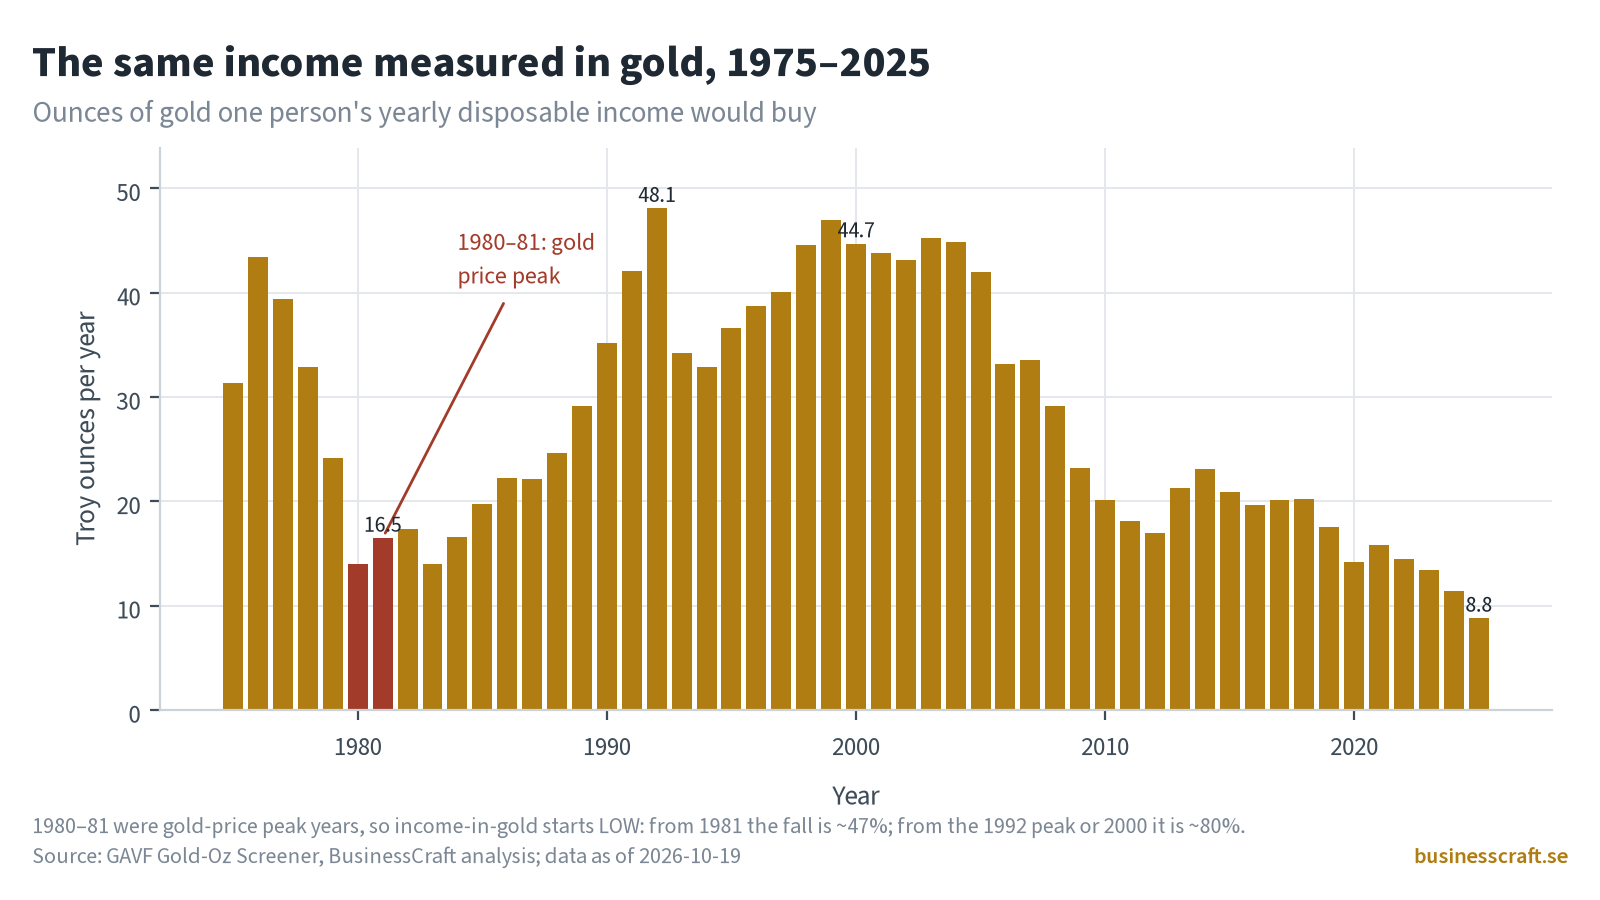
Gold priced in kronor rose 14.5 times over the period. Measured in gold, one year’s disposable income per person bought 16.5 ounces in 1981 and 8.8 ounces in 2025, a fall of 47% (Chart 2).
A caution on the starting point. 1980–81 were gold-price peaks, so income measured in gold started low (14.0 oz in 1980). Pick a different base and the drop looks bigger: from the 1992 high of 48.1 oz, or 44.7 oz in 2000, the fall is about 80%. The base year changes the size of the decline, not its direction since the 2000s. Gold also lagged houses for most of 1985–2019, so the ranking below holds for the full period, not every year in between.
Putting it together
What 100 SEK of 1981 buys in 2025, by measuring stick (Chart 3):
- Consumer basket (KPI): about 27 SEK
- Houses: about 10 SEK
- Gold: about 7 SEK
The feeling that pay buys less is real. But its source is mainly asset inflation and a krona that has lost value against hard money, not the shop shelf. Against ordinary consumer prices, the average paycheck has kept well ahead.
Limits and caveats
- Income is a proxy, not wages: disposable income per person, after tax and including transfers.
- Averages hide distribution; a first-time buyer’s experience may differ sharply from the average.
- Price indices only: no rent, dividends, interest or quality change.
- Results depend on the base year, especially for gold (see the 1980–81 peak above).
- Full years only, 1981–2025; data frozen 2026-10-19 and reused from post 02.
Related reading
- The Evolution of Money: From Bretton Woods to Fiat Currency Dominance
- The Debt Reckoning: Why Soaring Government Debt Is Becoming a Global Economic Turning Point
- Global Gold Mining Leaders 2025
- Who really shrank? Buybacks measured in gold, 2015–2026
- Safe as houses? Swedish homes, debt and the krona measured in gold, 1975–2026
Source: BusinessCraft analysis of open series from SCB, Riksbank, FRED and datahub.io; data as of 2026-10-19. Not investment advice. Past data says nothing certain about the future.