
Where the krona went: money supply, rates, CPI and houses
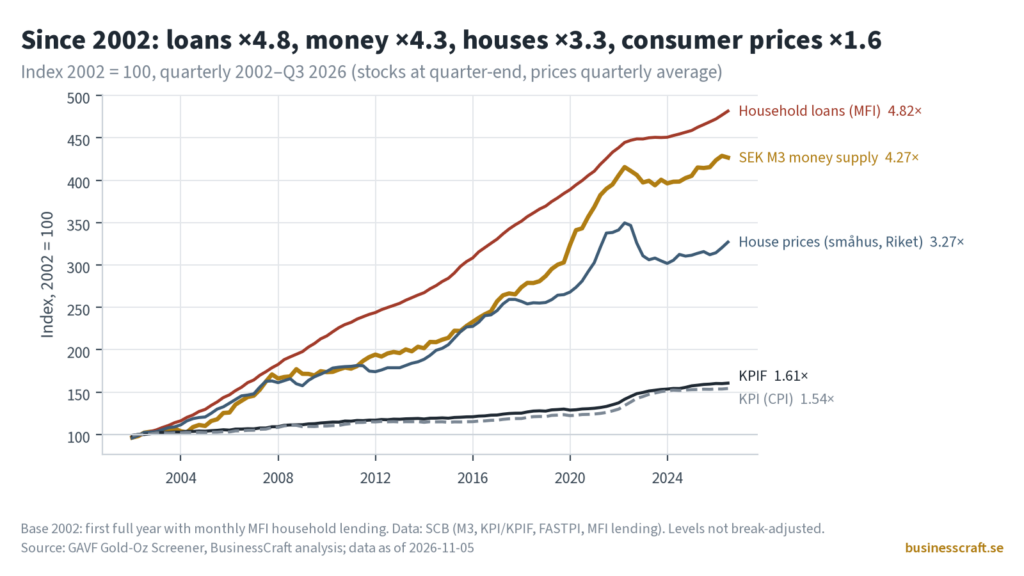
Educational analysis, not investment advice. No trading signals; the charts show co-movement, not cause and effect. Läs på svenska: Vart tog kronan vägen? Penningmängd, ränta, KPI och villor Swedish inflation came in on the low side in October. SCB’s flash estimate put KPIF at 1.1% and KPI at 0.9%, published the day after the Riksbank […]
Vart tog kronan vägen? Penningmängd, ränta, KPI och villor
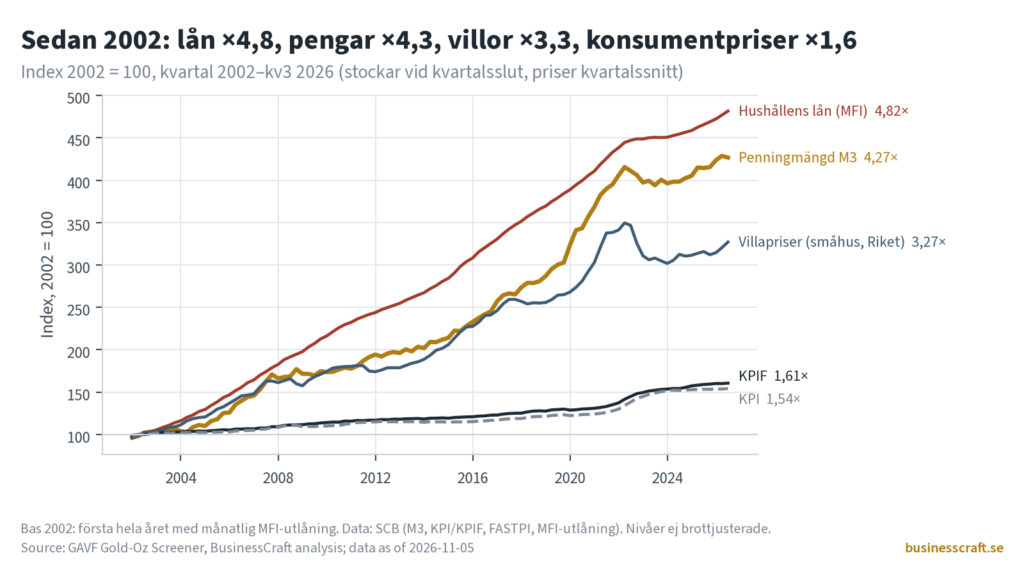
Utbildande analys, inte investeringsråd. Inga handelssignaler; graferna visar samvariation, inte orsak och verkan. Read in English: Where the krona went: money supply, rates, CPI and houses Den svenska inflationen blev lägre än väntat i oktober. SCB:s Snabb-KPI visade KPIF 1,1 % och KPI 0,9 %, och siffrorna kom dagen efter att Riksbanken höjt styrräntan till […]
Why your krona paycheck buys less: prices, houses and gold, 1981–2025
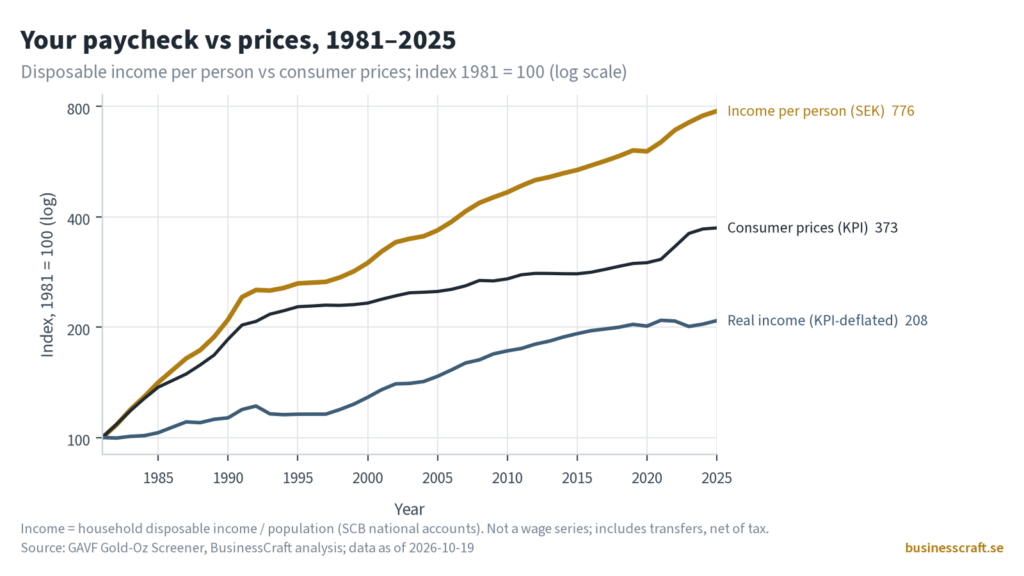
Ask a Swede whether their krona paycheck goes as far as it used to and most will say no. The data give a more precise answer: it depends on what you measure the paycheck against. Against ordinary consumer prices, the average Swede’s income buys more than it did in 1981. The sense that it buys […]