Educational analysis of money printing in gold terms, not investment advice. No trading signals; descriptive only.
“They just print more money” is one of the most common explanations for why things cost more. There is something to it: the stock of money in the US, the euro area and Sweden is several times larger than it was in 1999. However, measure those same money stocks in gold, and something unexpected happens. They shrink.
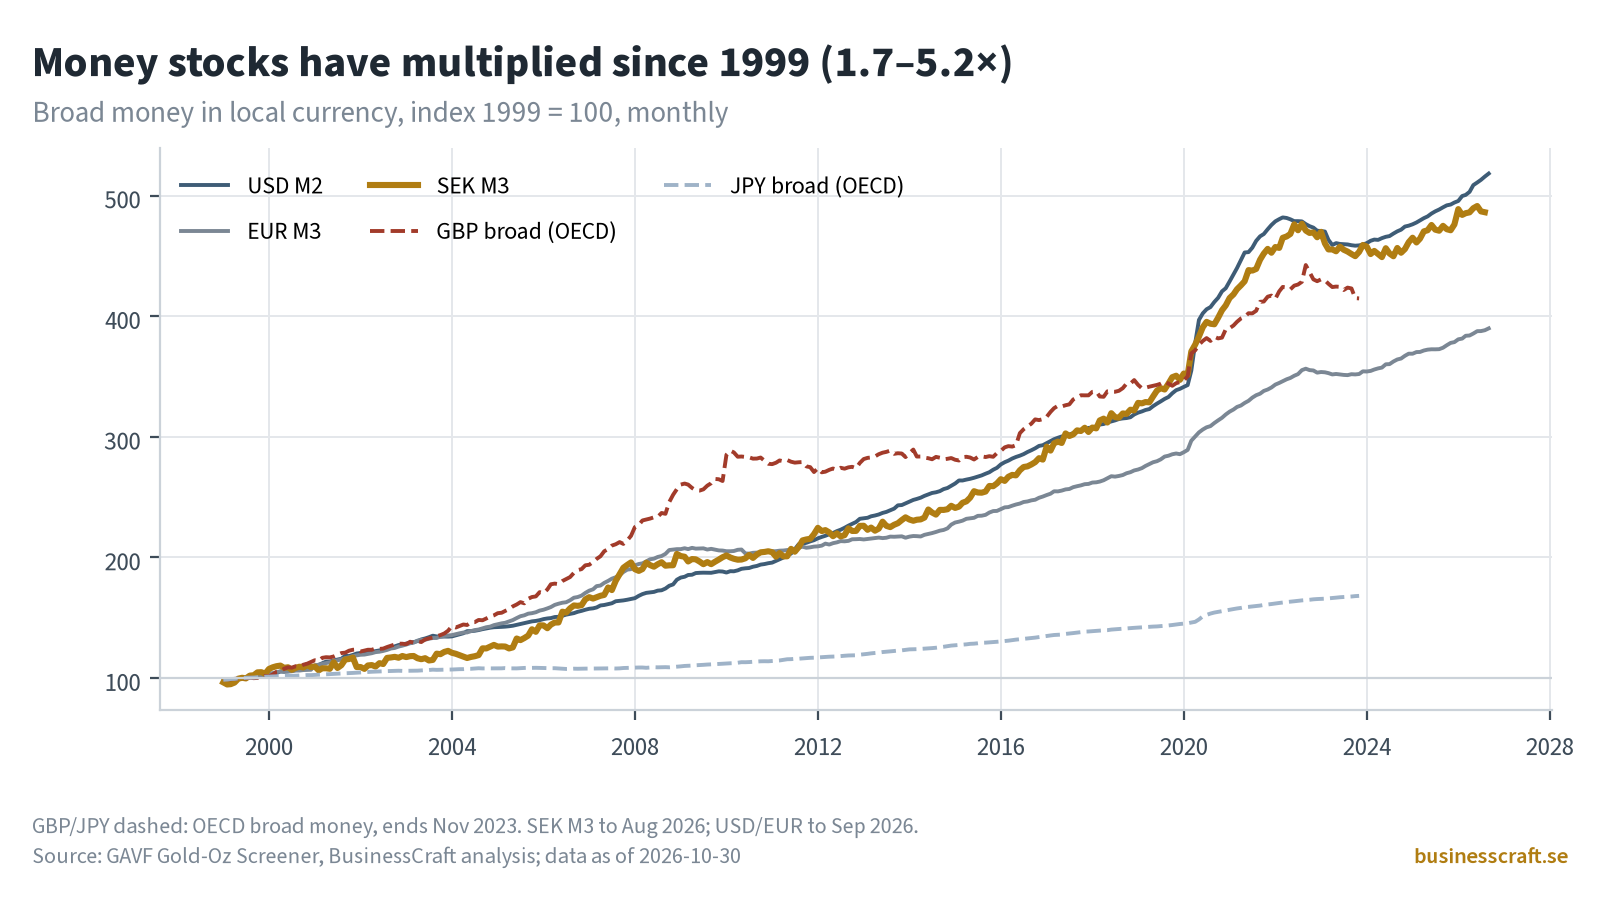
1. Money stocks in local currency (Chart 1)
First, Chart 1 indexes the broad money stock in each currency to 1999 = 100. Since 1999:
- US M2 has grown 5.2 times, to about 23.4 trillion dollars (September 2026).
- Meanwhile, Swedish M3 has grown 4.9 times, to about 5,185 billion kronor (August 2026).
- Likewise, euro-area M3 has grown 3.9 times, to about 17.7 trillion euros (September 2026).
- UK broad money grew 4.2 times and Japanese broad money 1.7 times, but these OECD series end in November 2023 and appear dashed.
So in their own units, every money stock went up, and most went up a lot.
2. Money printing in gold: the same money measured in gold (Chart 2)
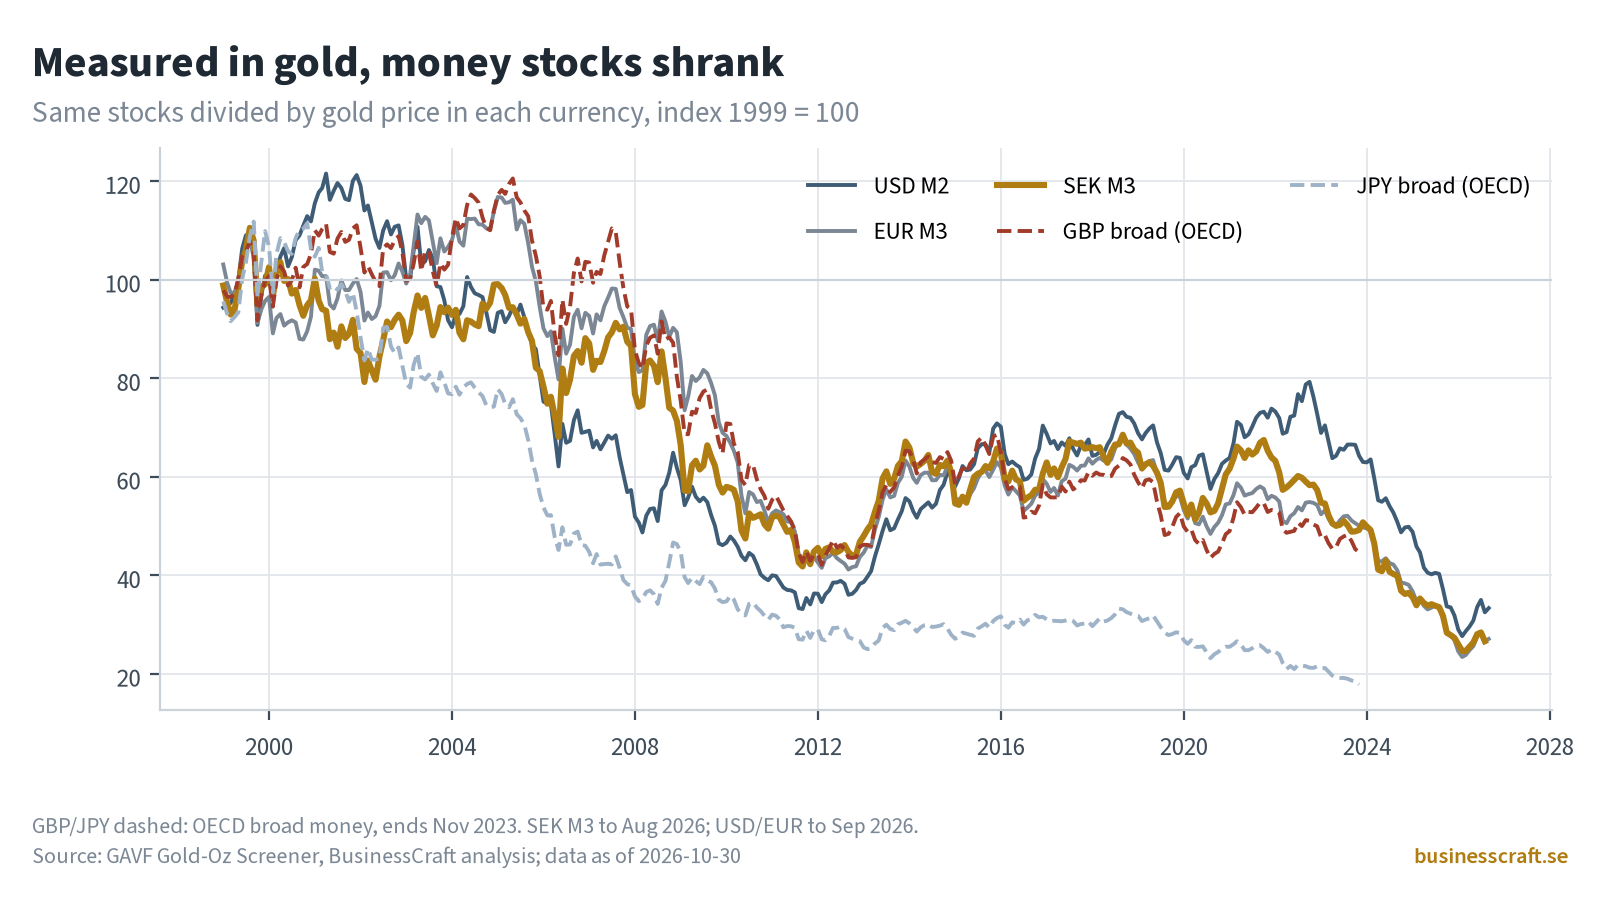
Next, divide each money stock by the gold price in that currency. That tells you how many ounces of gold the whole money stock could buy. As a result, since 1999 the result is the opposite of Chart 1:
- US M2 is about 0.33 times its 1999 size in gold, about 5.4 billion ounces.
- Similarly, euro-area M3 and Swedish M3 are both about 0.27 times their 1999 size.
- In addition, UK broad money is about 0.45 times and Japan about 0.18 times (to 2023).
In other words, gold rose faster than the money supply. Although the money stocks grew, the price of gold in each currency grew more, so the gold value of all that money fell.
3. Recent growth (Chart 3)
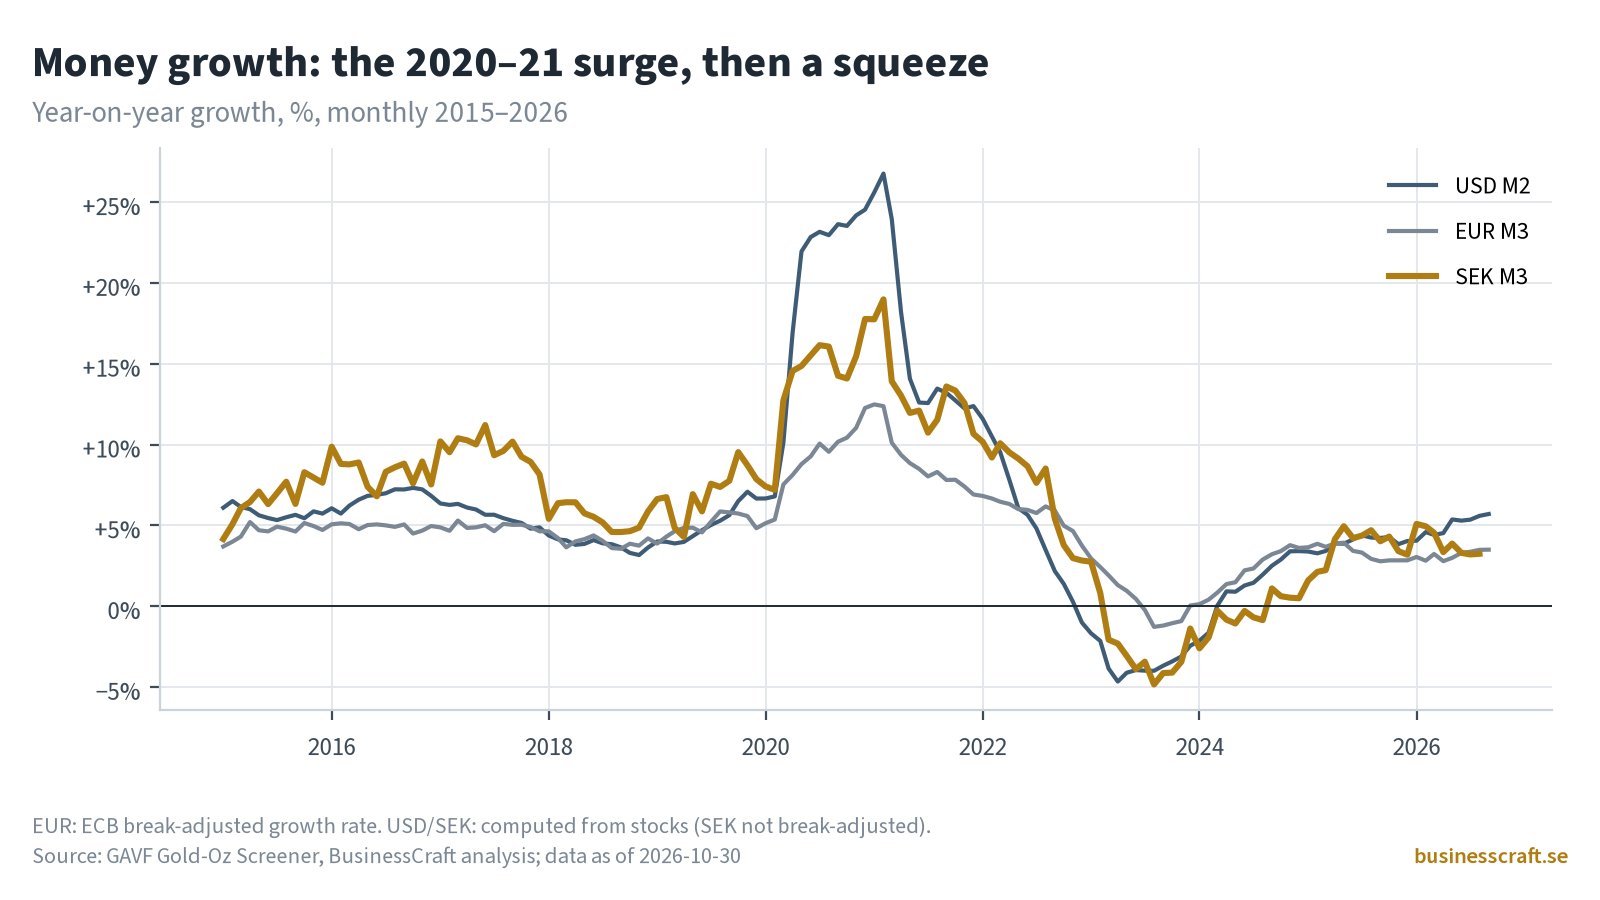
Chart 3 shows year-on-year money growth from 2015. Overall, the latest readings are modest: US M2 +5.7% (September), euro-area M3 +3.5% (September) and Swedish M3 +3.3% (August).
What this does and does not say
This is a descriptive picture. For example, it shows that gold has re-rated against fiat money over this period: more than the growth in money supply alone would account for. It is not a claim that money growth predicts the gold price, and it says nothing about next year. Instead, gold has its own drivers, from real interest rates to central-bank buying. Also, this post is not our planned model backtest; that is a separate piece of work.
The base year matters here too. Because 1999 sat near a gold low, the fall in gold terms looks large; a different starting point would give different multiples.
Limits and caveats
- UK and Japanese money use OECD broad-money series via FRED that end in November 2023; we pulled no free, consistent Bank of England or Bank of Japan series. The charts draw them dashed.
- Furthermore, euro-area M3 levels are ECB stocks with a changing country composition (enlargement adds level steps); growth rates use the ECB’s break-adjusted figures.
- Swedish M3 is from SCB to August 2026; SCB does not break-adjust the levels. We use no pre-1999 splice.
- For US M2 we use the seasonally adjusted series; euro and krona series appear as published.
- This post does not include a planned fourth chart (money per unit of real GDP).
Source: BusinessCraft analysis of FRED (US M2, OECD broad money), ECB Data Portal (euro-area M3), SCB (Swedish M3) and LBMA gold via datahub.io; data fetched 2026-10-30. Educational analysis, not investment advice. No trading signals. Past data says nothing certain about the future.
Disclaimer: Educational analysis, not investment advice. No trading signals; descriptive only.
Related reading: why your krona paycheck buys less and Swedish homes and the krona measured in gold. For official money supply statistics, see the Riksbank. Money printing in gold terms looks very different from money printing in local currency.