US consumer prices rose 0.4% in October and core prices 0.3%, the third 0.3% core reading in a row (BLS, 10 November). That is the level at which Fed Governor Waller said this morning a 50 bp December hike “should be considered”. Our answer to what that means: on history, Fed hikes have not hurt gold, and a 50 bp move would add only about 15 bp to the Swedish rate path.
Two inflation stories, one measuring stick
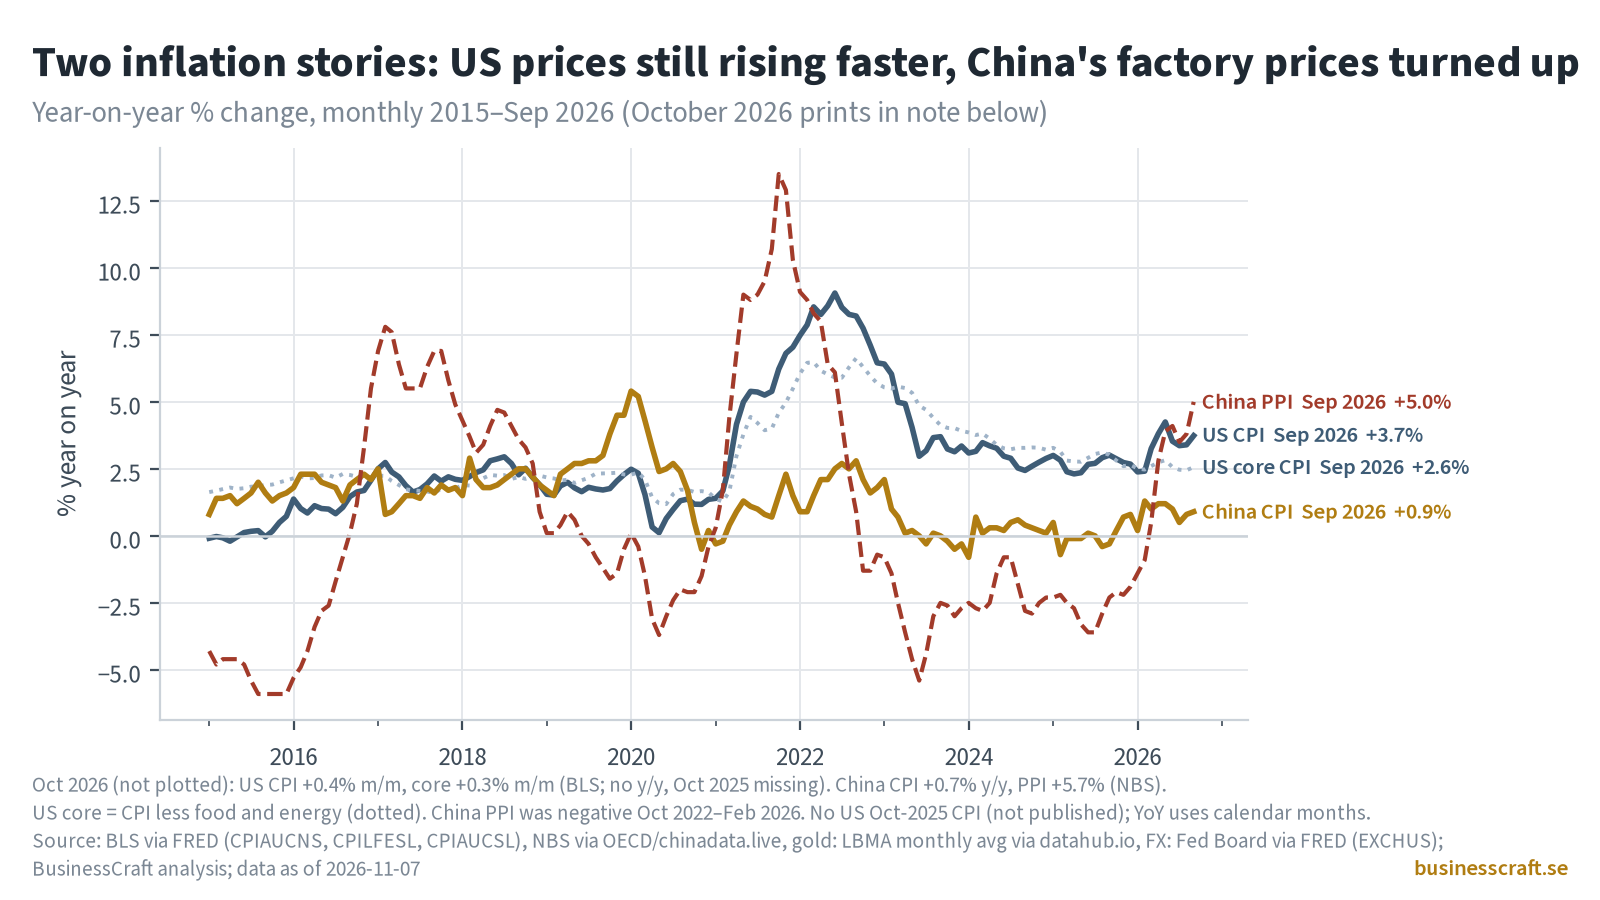
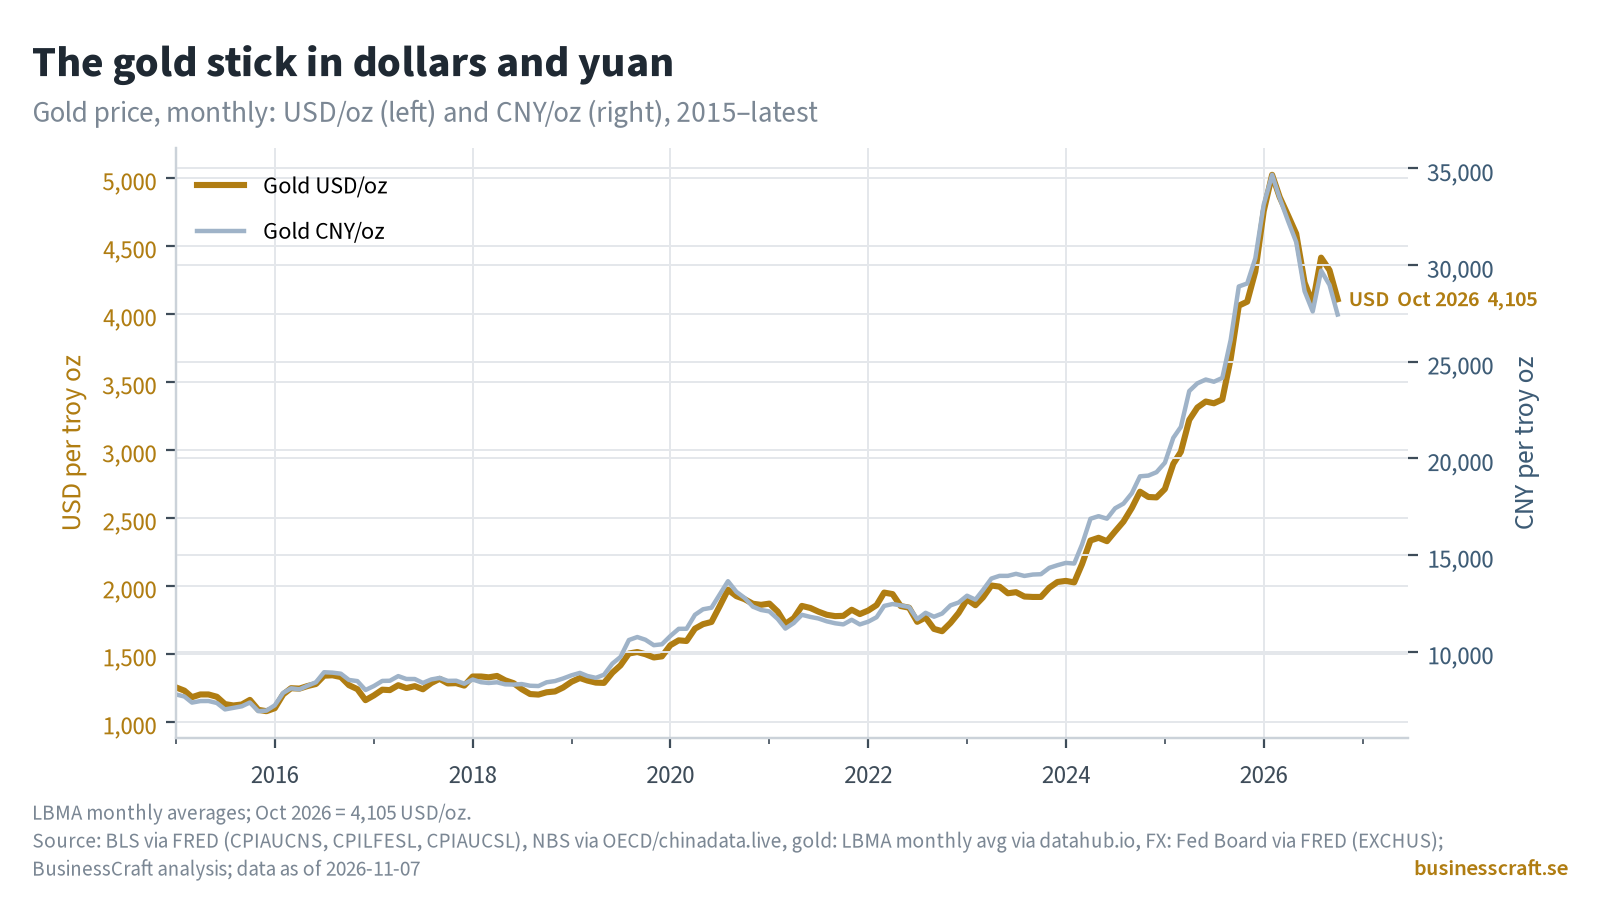
In the US, the October consumer price index rose 0.4% from September (seasonally adjusted) after +0.6%. Prices excluding food and energy rose 0.3%, as in August and September, an annualised pace of about 3.7% over three months. Consensus had been +0.3% and +0.2% (Trading Economics). There is no year-on-year rate: BLS collected no October 2025 data during the 2025 funding lapse, so September’s 3.7% remains the latest annual figure. China’s consumer prices rose only 0.7% on the year in October (core 0.8%), while its factory-gate prices rose 5.7%. The pressure there is upstream: mining +27.9%, raw materials +11.6%, consumer-goods factory prices −0.1%, and producers’ purchase prices +7.9%, faster than the prices they charge (NBS, 9 November). That squeezes manufacturers’ margins; it is not yet an inflation shock for households (Chart 1).
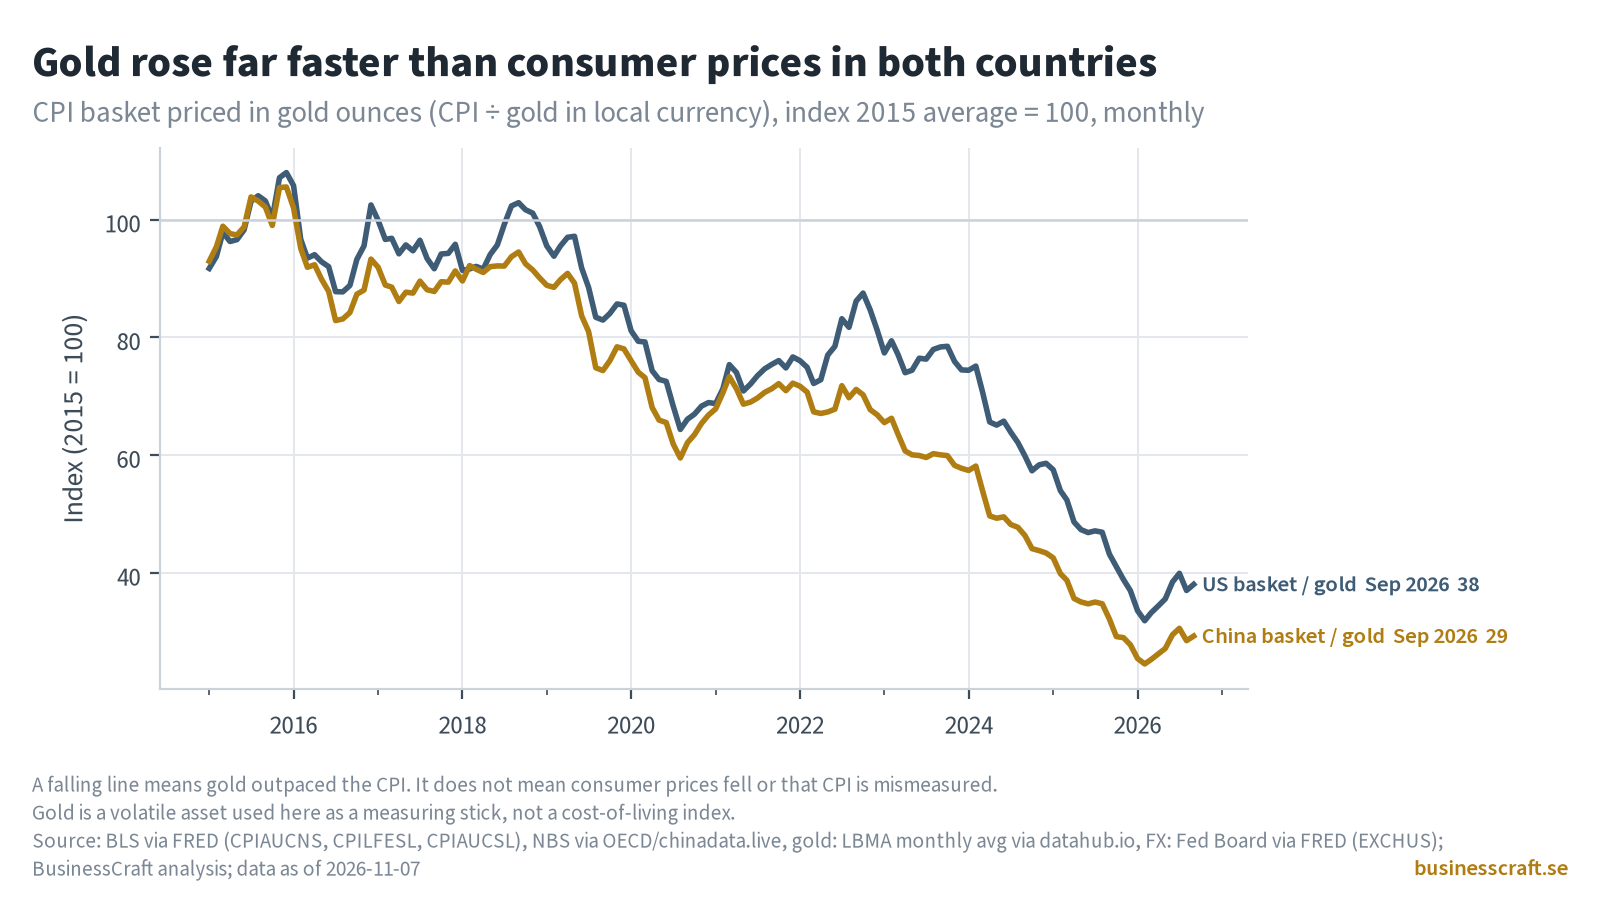
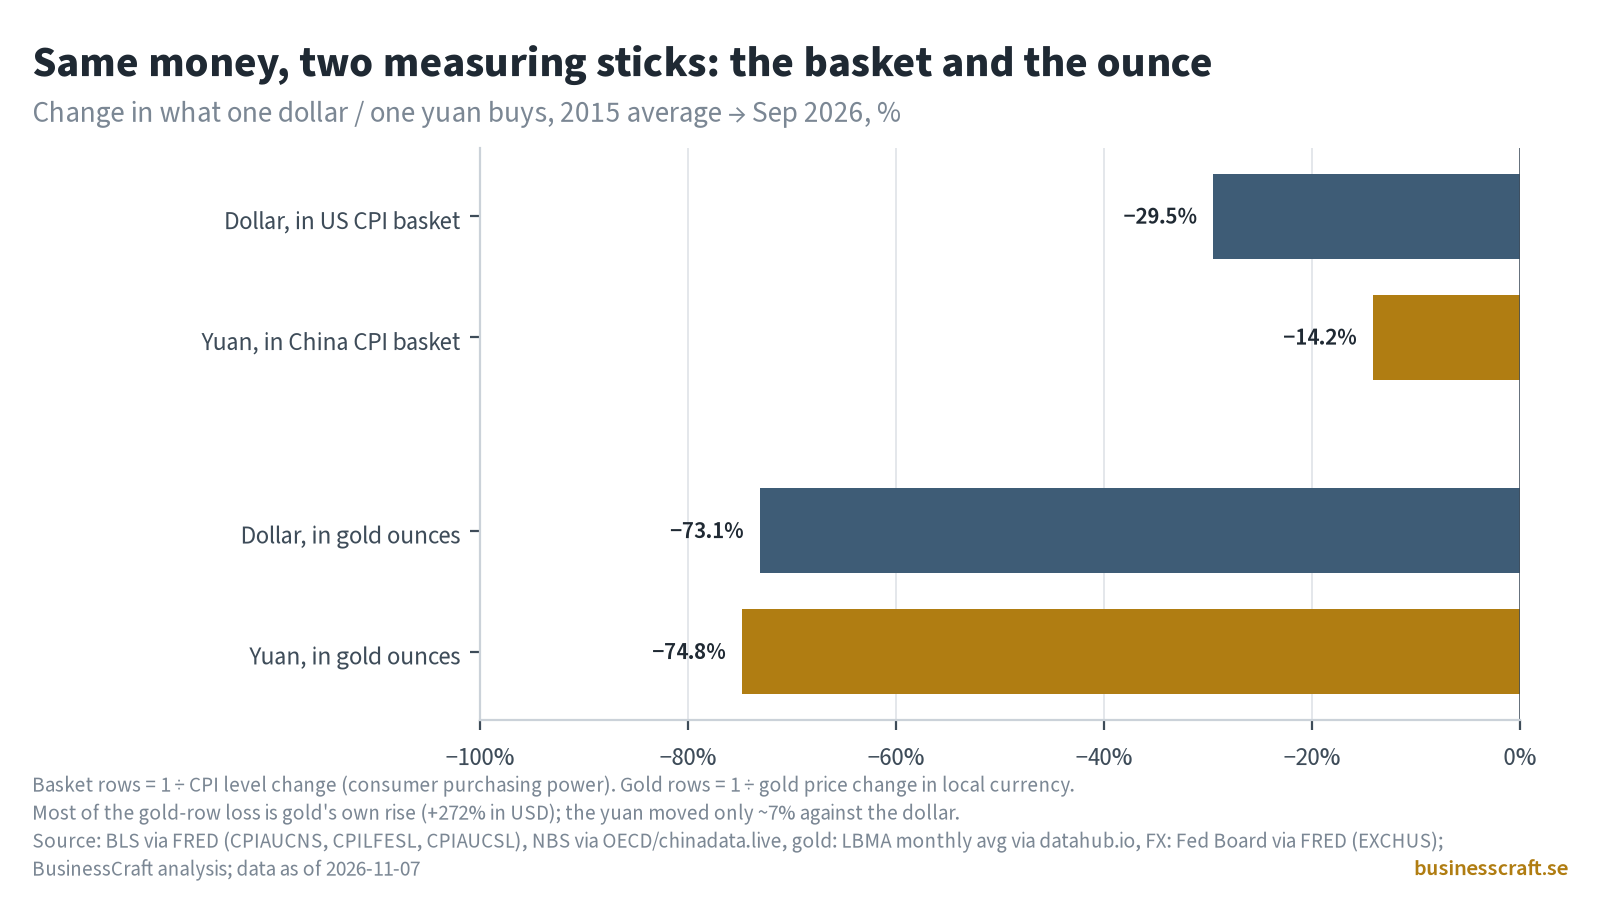
From the 2015 average to September 2026 a dollar lost 29.5% of what it buys in the US consumer basket and a yuan 14.2% in China’s. Measured in gold, both lost about three quarters (−73.1% and −74.8%), because gold itself rose 272% in dollars (Charts 2–4). The measuring stick decides the story.
A rate hike measured in gold
The Fed’s own gauge, PCE inflation, was 3.7% in September (core 3.1%). The Fed’s range is 3.75–4.00% after a September hike; it meets on 8–9 December. Governor Waller said today he leans towards 25 bp even if October improved, and that 50 bp should be considered if core CPI ran at about 0.3% or more (federalreserve.gov, 10 November). October met that threshold. Before the print, markets already priced a December hike as likely (the Riksbank’s 4 November update notes “a high probability”, with one to two further hikes next year). We use +25 bp to 4.00–4.25% as the base case and +50 bp to 4.25–4.50% as the scenario.
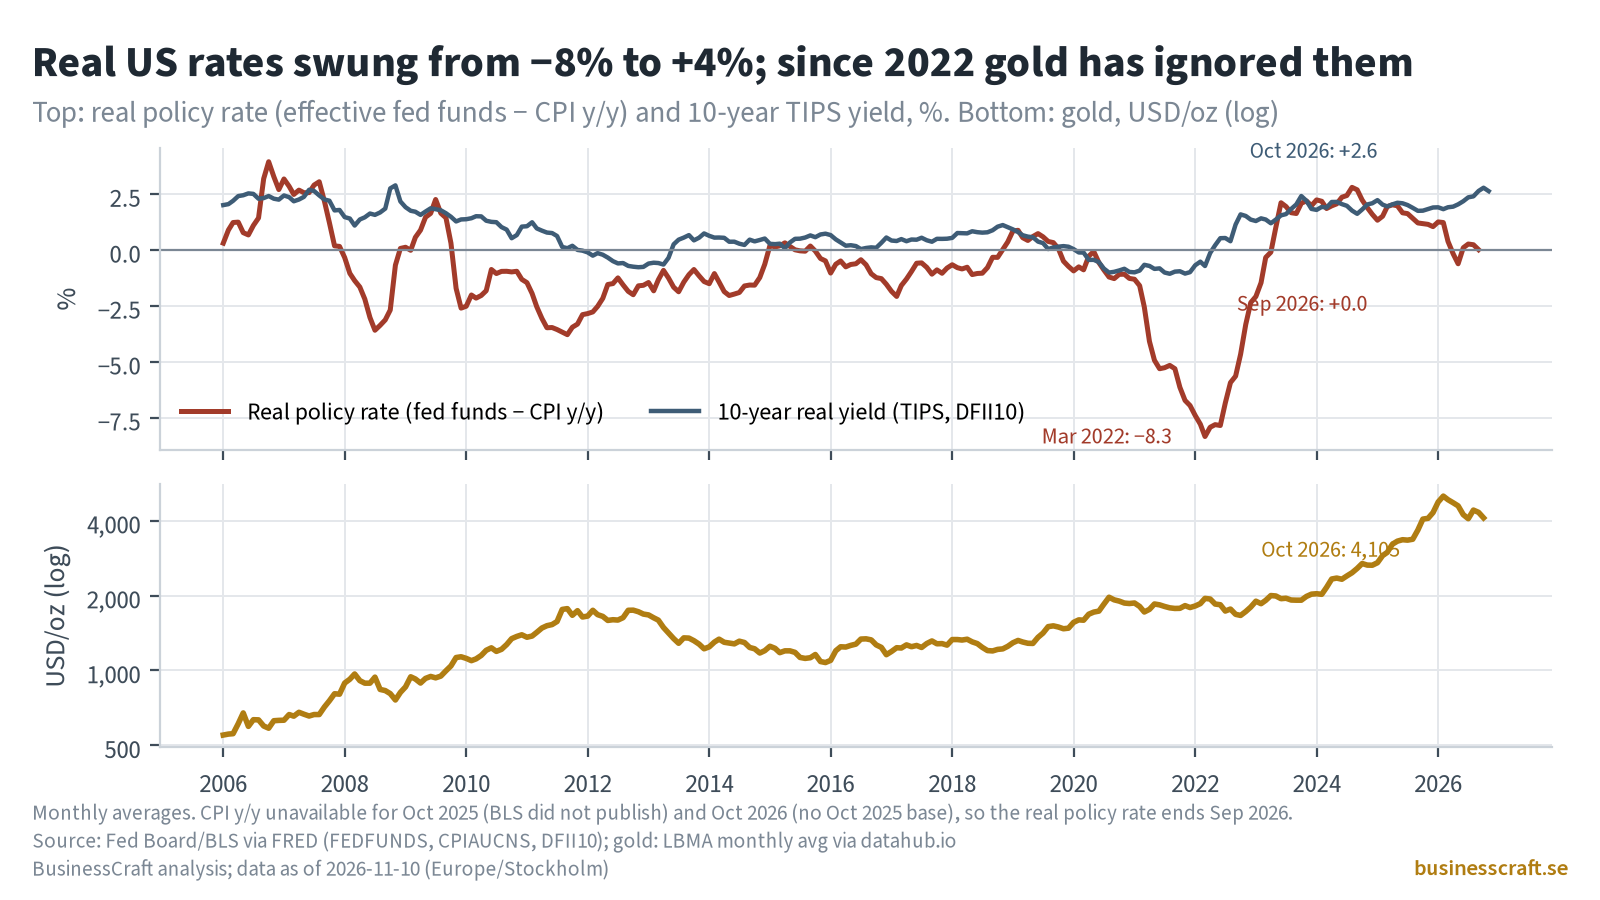
- Real rates (Chart 5). The real policy rate (fed funds minus CPI inflation) ranged from −8.3% in March 2022 to about +3.9% in 2006 and stood at roughly 0.0% in September. The 10-year real yield is 2.6%. From 2006 to 2021 gold moved tightly against real yields (r = −0.93). Since 2022 that link has broken: gold rose together with real yields (r = +0.54).
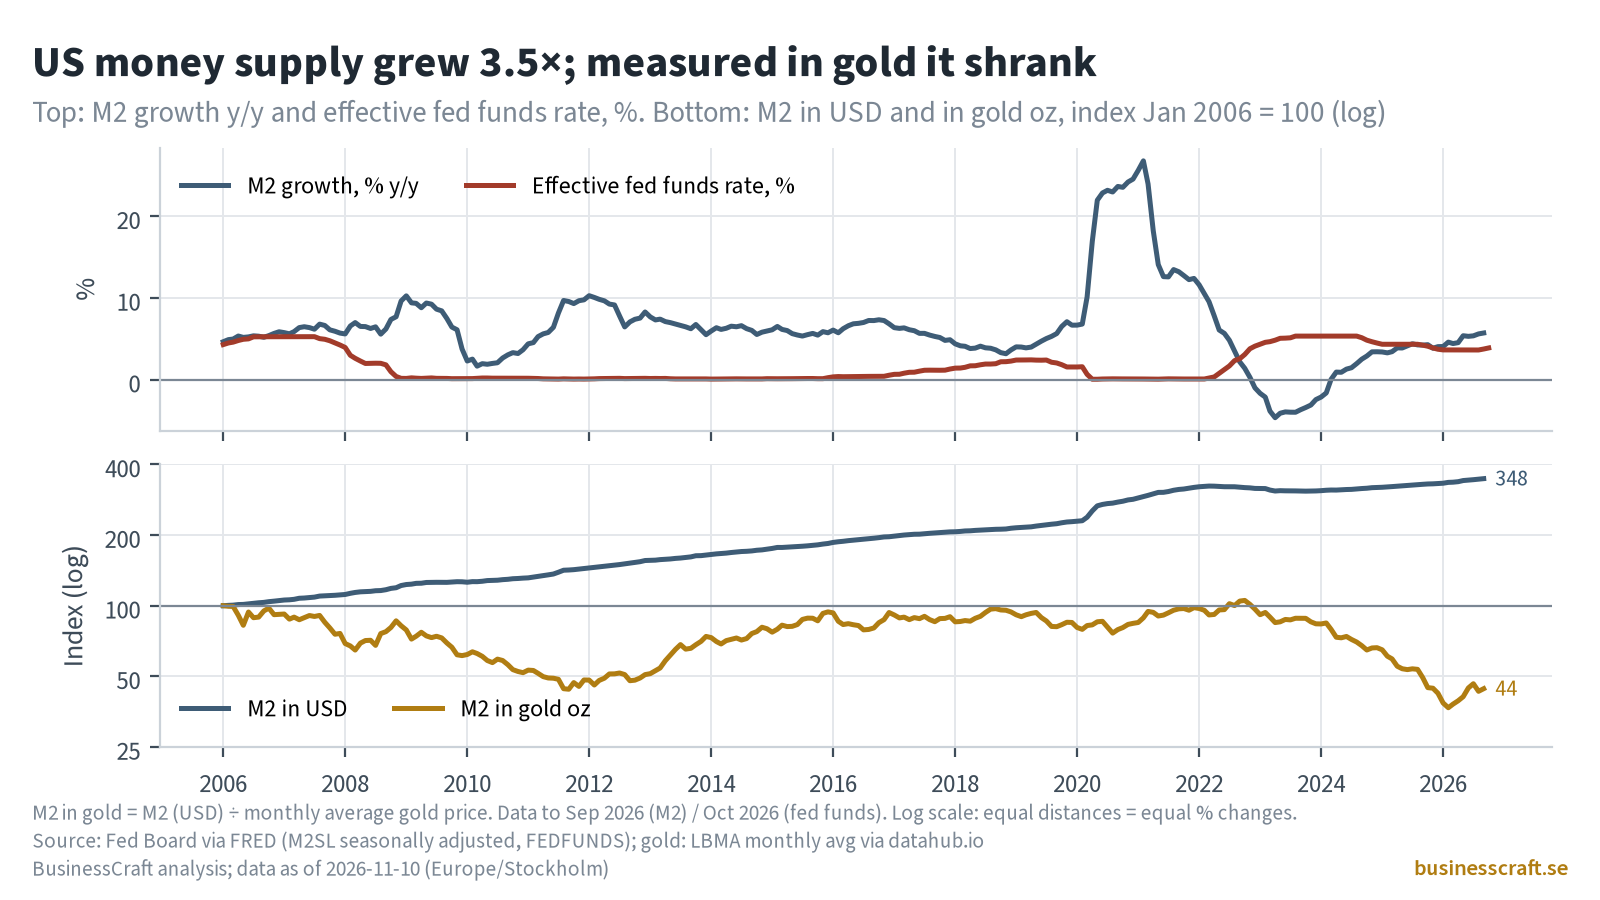
- Money (Chart 6). US M2 is 3.5 times its January 2006 level (USD 23.4 trillion). Measured in gold it is 56% smaller (12.2 billion oz then, 5.4 billion now). M2 growth went from +26.8% (February 2021) to −4.7% (April 2023) and is back at +5.7%, even with fed funds near 3.9%.
- Past hike cycles (Chart 7). From first to last hike, gold rose 52% in 2004–06 and 16% in 2015–18, and was flat in 2022–23, even though the real policy rate rose by roughly 3, 1 and 10 points. Only in the young 2026 cycle has gold fallen so far (−5% in one month, September to October average).
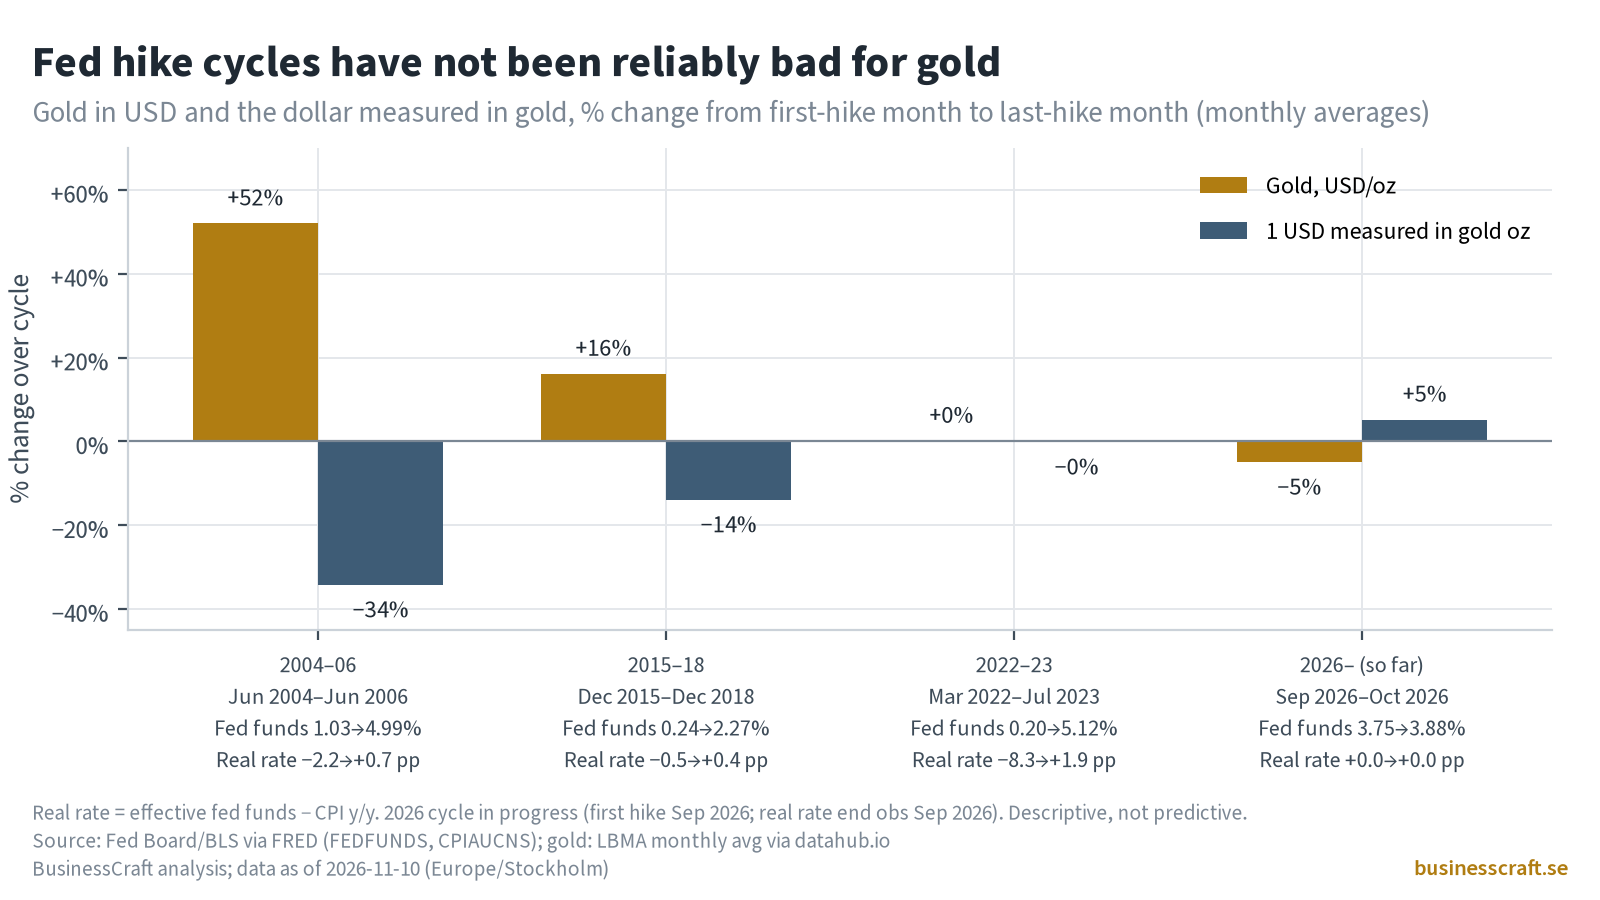
Our reading: Fed hikes have not made the dollar stronger against gold. The dollar lost 34% and 14% of its gold value in the first two cycles and held steady in the third. A December hike, 25 or 50 bp, is a reason to expect higher US borrowing costs. On history it is no reason to expect a lower gold price in dollars.
What 20 years of Fed turns did to Sweden
Charts 8 and 9 line up Fed decisions with the Riksbank and the krona since 2006 and measure the lead and lag. Correlation is not causation: much of the co-movement comes from shocks that hit both economies at once (2008, 2020, the 2022 energy shock).
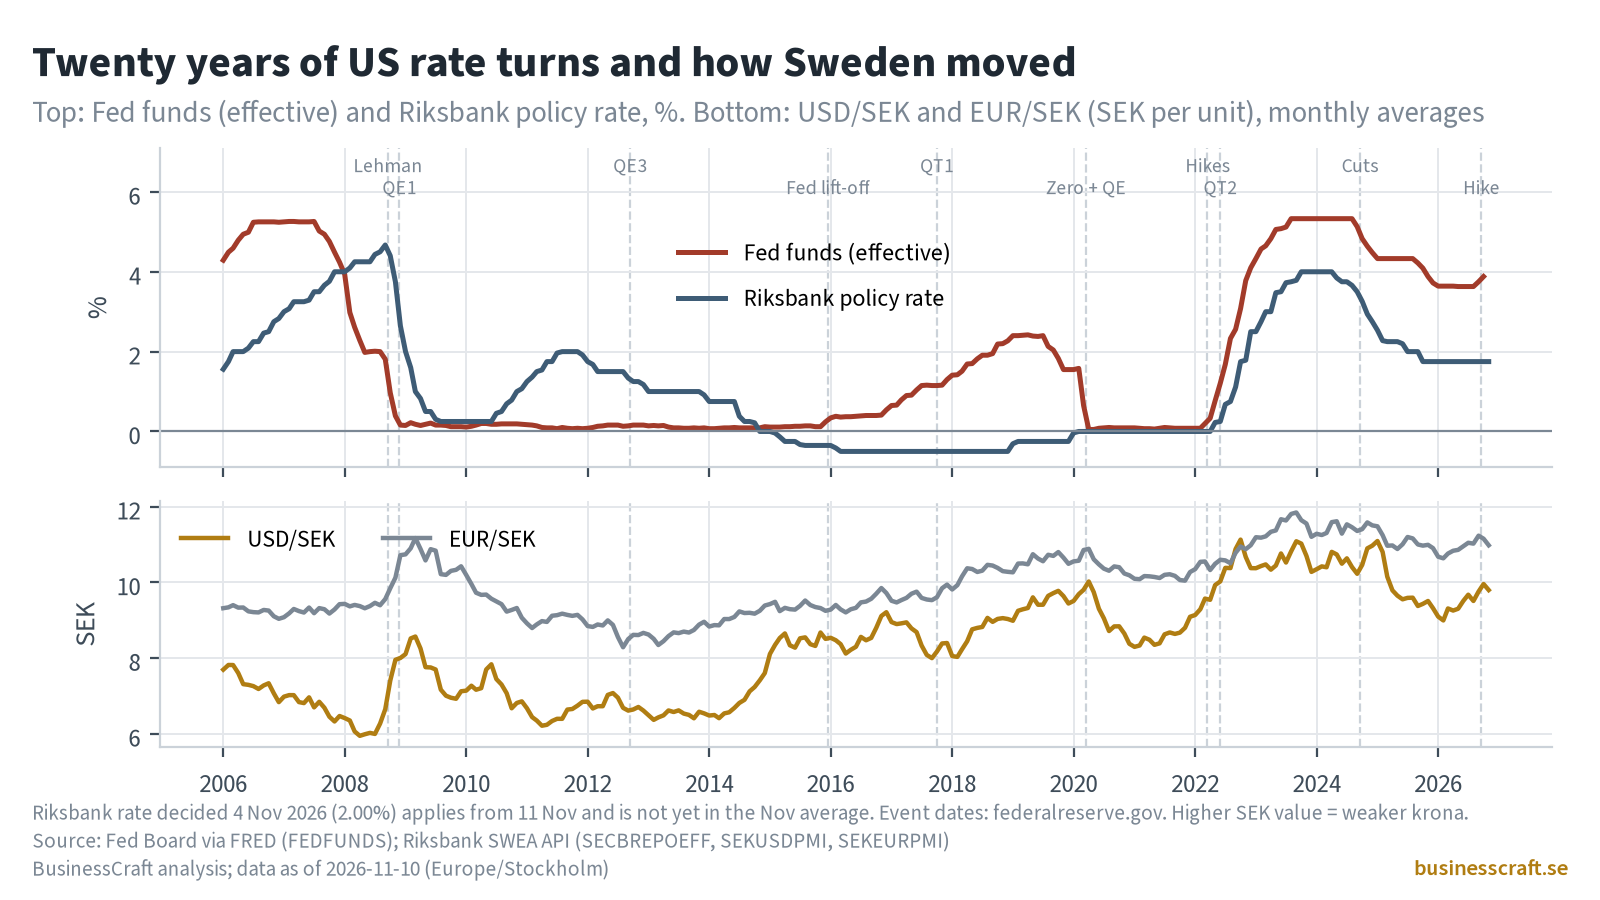
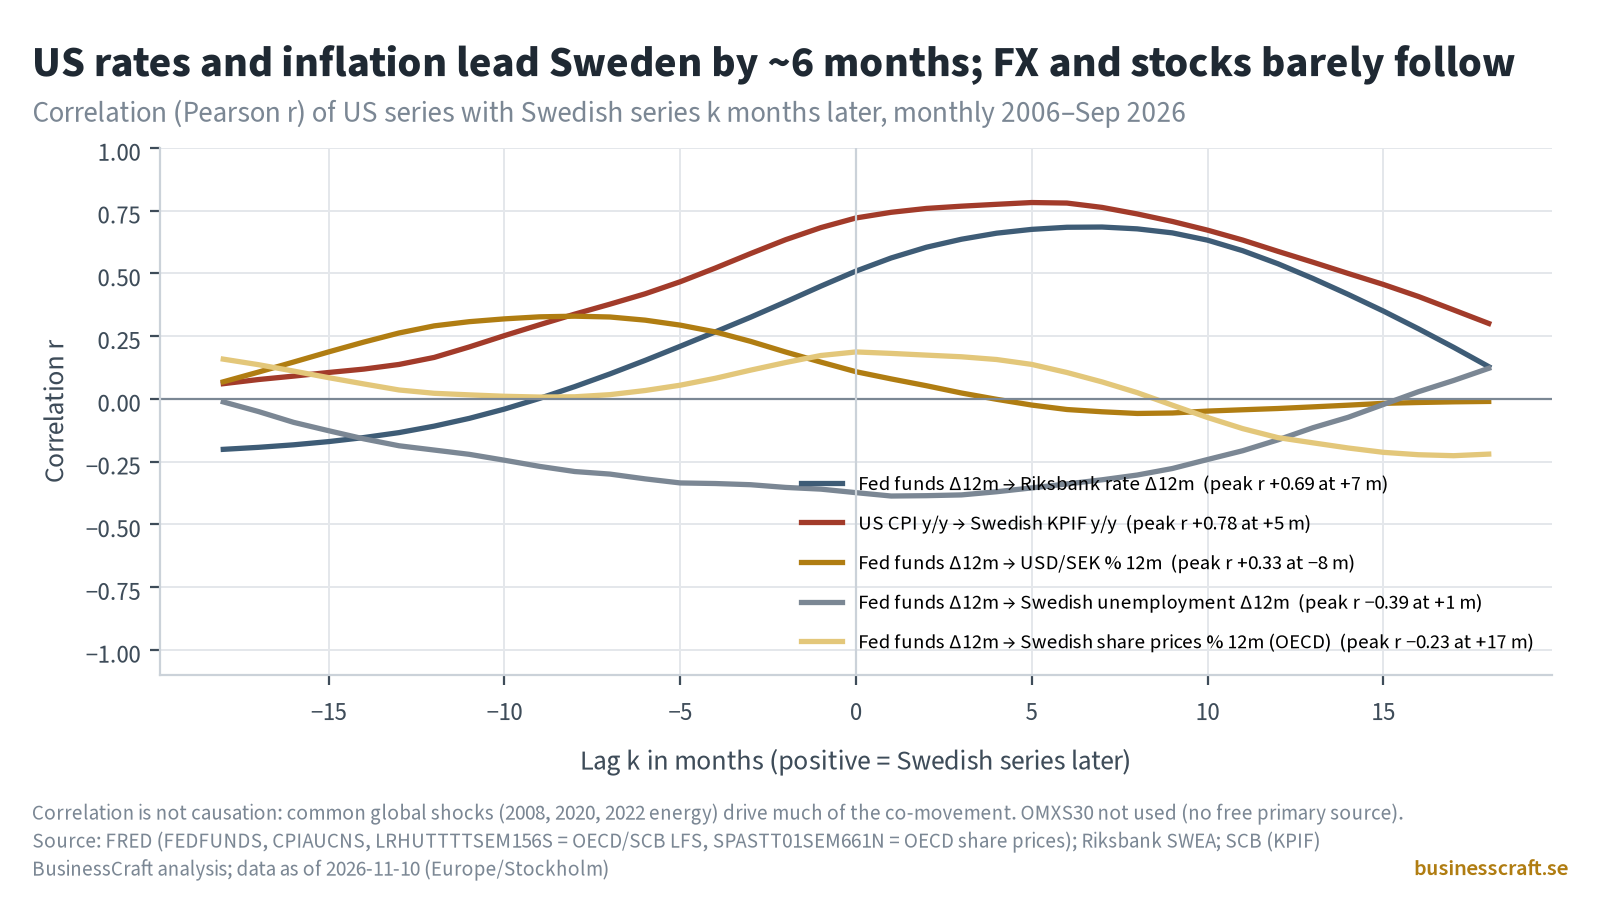
- Rates follow with a lag. A change in the fed funds rate over twelve months is matched by a change in the Riksbank rate about seven months later (r = 0.69). On average the Riksbank moved 0.6 points for every 1 point the Fed moved.
- Inflation travels too. US CPI inflation leads Swedish KPIF inflation by about five months (r = 0.78).
- The krona and stocks do not follow the Fed reliably. Fed moves explain little of USD/SEK (peak r = 0.33, with the krona moving first) or of Swedish share prices (|r| ≤ 0.23). Unemployment tends to fall while the Fed hikes (r = −0.39), which is the shared business cycle at work.
The episodes show the pull and its limits:
| Episode | Fed (upper bound) | Riksbank | Sweden’s reaction |
|---|---|---|---|
| 2008 | cut 5.25% → 0–0.25% | hiked to 4.75% (Sep 2008), then cut to 0.25% | USD/SEK 6.7 → 8.6, unemployment 6.2% → 9.1%, GDP −6.3% y/y, shares −49% at the trough |
| 2015–18 | hiked 0.25% → 2.50% | cut to −0.50% and held | USD/SEK 8.5 → 9.2; first hike decided only in December 2018 |
| 2020 | cut to zero, QE | held at 0%, bought bonds | USD/SEK peak 10.0, unemployment 9.6%, GDP −7.5% |
| 2022–23 | hiked 0.25% → 5.50% | hiked 0% → 4.00% | KPIF peak 10.2%, USD/SEK 11.1, GDP −1.3%, shares −17% at the trough |
The Riksbank followed the Fed in 2022 because Swedish inflation was also at 10%. It went the other way in 2015–18 because Swedish inflation was low. The Fed sets the global weather; Swedish inflation sets the Riksbank’s path.
Sweden’s rate scenarios: then and now
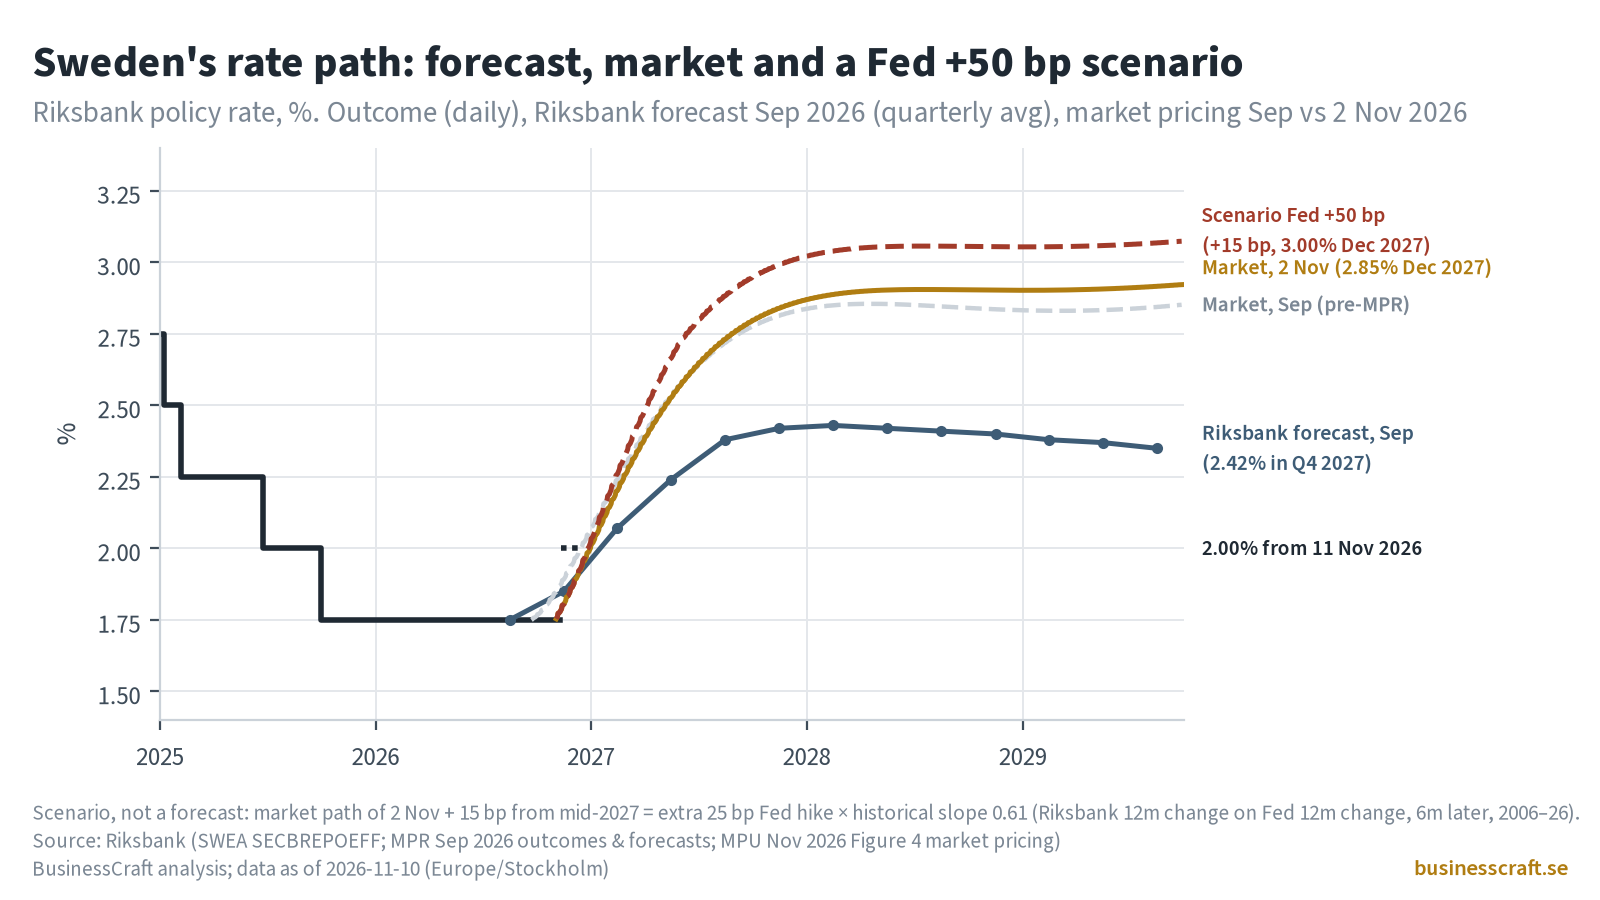
Our previous rate-scenario post, “Where the krona went: money supply, rates, CPI and houses“ (5 November), drew three illustrative paths for 2027–2029. Since then the hike to 2.00% has been decided (it applies from tomorrow, 11 November), SCB’s flash estimate put October KPIF at 1.1% and KPIF excluding energy at 0.1%, against Riksbank September forecasts of 1.7% and 0.6%, and the US case for a larger hike has grown. Chart 10 adds a fourth path.
| Scenario | Then (5 Nov) | Now (10 Nov) |
|---|---|---|
| 1. Soft landing | KPIF 1–2%, rate 1.75–2.5% | Still our base case. The Riksbank’s September forecast (2.42% by Q4 2027) sits inside it. |
| 2. Credit and housing rebound | Lower rate, real rate near zero | Least likely. The Riksbank is hiking, and markets price higher rates. |
| 3. Renewed inflation, tight money | KPIF above 2%, rate above 2% | Already in market pricing: 2.85% by December 2027 (Riksbank compilation, 2 November). |
| 4. New: Fed +50 bp in December | — | Market path +15 bp, about 3.0% by end-2027. |
Assumptions for scenario 4: the Fed raises to 4.25–4.50% on 9 December instead of 4.00–4.25%. The Riksbank responds as it did on average in 2006–26, 0.6 points per Fed point with about a six-month lag. So an extra 25 bp in Washington adds about 15 bp in Stockholm. This is arithmetic on a historical average, not a forecast.
Our base case: the Riksbank ends 2027 between its own path (2.4%) and market pricing (2.85%). Even a 50 bp Fed move would not push it meaningfully above 3%. That takes Swedish inflation, not US inflation.
What this means for a Swedish household
- Imported inflation runs through the krona, and the krona is moving on its own. The dollar cost 9.96 kronor on average in October, 5.6% more than a year earlier (9.43). The euro cost 1.7% more. The Riksbank cites the weaker krona as one reason inflation should exceed 2% next year. It has since firmed to 9.82 (9 November), and history gives no reliable rule that a Fed hike weakens it.
- Mortgage arithmetic. Each 1 MSEK of variable-rate mortgage costs an extra 208 kronor a month in interest per 0.25 point, 417 per 0.5 point and 833 per 1 point. After the 30% interest deduction that is about 146, 292 and 583 kronor. The +15 bp of a Fed +50 scenario is roughly 125 kronor a month per million before deduction.
- Gold is a measuring stick here, not a signal. Our own GAVF backtests show no trading edge from gold-measured levels. This is context for thinking, not a timing tool.
What we take from this
- The measuring stick decides the story. The yuan kept its value in the shops far better than the dollar. In gold, both lost about three quarters.
- China’s inflation sits at the factory gate. PPI is +5.7% and consumer-goods PPI −0.1%, so the pressure is landing on margins, not on households.
- US inflation is not cooling fast enough. Core CPI rose 0.3% for a third month and PCE is at 3.7%. A December hike is the base case; 50 bp is a live option.
- Fed hikes have not been gold’s enemy. Gold rose or held steady in every completed hike cycle since 2004, and the link to real yields broke in 2022.
- For Sweden, the Fed is weather, not climate. The Riksbank has moved about 0.6 points per Fed point, half a year later, and only when Swedish inflation agreed. A Fed +50 bp adds about 15 bp; our base case is 2.4–2.85% by end-2027.
Data notes: US CPI: BLS (October release 10 November 2026; FRED CPIAUCNS/CPIAUCSL/CPILFESL for history). BLS did not publish an October 2025 CPI, so there is no October 2026 year-on-year rate. Fed funds, M2, TIPS: Federal Reserve via FRED. PCE: BEA via FRED. China CPI/PPI: NBS (October releases of 9 November), with history via OECD and chinadata.live. Gold: LBMA monthly averages via datahub.io. Sweden: Riksbank (SWEA policy rate and FX, MPR September 2026 forecasts, MPU November 2026 market pricing); SCB (KPIF, Snabb-KPI October); unemployment from SCB’s LFS via OECD/FRED; share prices from the OECD all-share index for Sweden via FRED (OMXS30 is not used: it has no free primary source); GDP from Eurostat via FRED. Correlations are Pearson r on monthly data, 2006–September 2026.
Educational analysis, not personal investment advice.