

Shipping lanes look permanent on a map, but the routes ships actually take change with conflict, climate and commercial decisions. Since late 2023 the world’s main East–West trade lanes have been redrawn twice: first by detours away from the Red Sea, and now, in late 2026, by a gradual return. This article follows the data on what moved, what came back and what it means for companies that depend on sea freight.
The detour, in numbers
Oil flows are the best-documented indicator. According to the US Energy Information Administration, flows through the Bab el-Mandeb strait at the southern end of the Red Sea fell from 9.3 million barrels per day in 2023 to 4.1 million in 2024, while flows around the Cape of Good Hope rose from 6.2 million to 9.3 million (EIA). The pattern held through the first half of 2025.
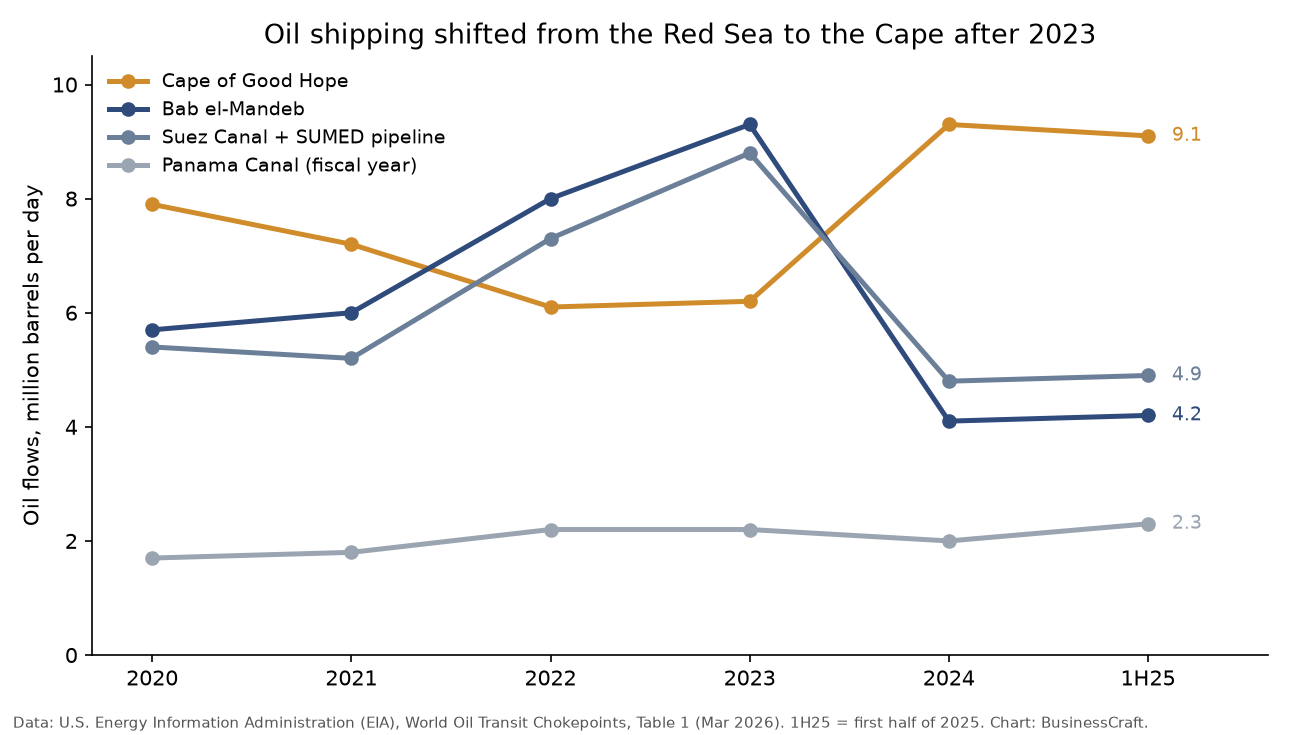
The effect reached far beyond oil. UNCTAD reports that rerouting pushed ton-miles, the distance each ton of cargo travels, up by a record 6% in 2024, nearly three times faster than trade volumes, and that by May 2025 tonnage through the Suez Canal was still 70% below 2023 levels (UNCTAD). Longer voyages absorb ship capacity, raise fuel use and lengthen lead times.
The rebound at Panama
The Panama Canal, constrained by drought in 2023–2024, recovered strongly. The canal authority reports 13,404 transits in fiscal year 2025, up 19.3% from 11,240 the year before (Panama Canal Authority).
The return to Suez
In autumn 2026 container lines began returning to the Suez Canal. The Suez Canal Authority reported Evergreen’s return on 8 November and ONE’s on 15 November, noting that three more Premier Alliance services were scheduled to follow (Suez Canal Authority, 8 Nov; Suez Canal Authority, 15 Nov). A return is not instantaneous: services are restored one by one, and schedules settle over months.
What route changes mean for businesses
| Effect | During the detour | As routes return |
|---|---|---|
| Transit time Asia–Europe | Longer, via the Cape | Shorter, but schedules reset service by service |
| Ship capacity | Absorbed by longer voyages | Released back to the market |
| Freight rates | Pushed up and volatile | Downward pressure as capacity returns |
| Planning | Safety stock and longer lead times | Risk of over-stocking if buffers are not reduced in time |
Table: BusinessCraft assessment based on the sources linked in this article.
Three practical steps follow: review contract clauses on routing and surcharges, adjust safety stock as transit times change, and track carriers’ service announcements rather than assuming a single switch-back date. If you are also weighing northern alternatives, see our analysis of Arctic trade routes in 2026.
Key figures
| Figure | Value | Source |
|---|---|---|
| Bab el-Mandeb oil flows | 9.3 (2023) → 4.1 (2024) million b/d | U.S. EIA |
| Cape of Good Hope oil flows | 6.2 (2023) → 9.3 (2024) million b/d | U.S. EIA |
| Growth in ton-miles, 2024 | ≈ 6% (record) | UNCTAD |
| Suez Canal tonnage, May 2025 vs 2023 | ≈ 70% lower | UNCTAD |
| Panama Canal transits, FY2025 | 13,404 (+19.3%) | Panama Canal Authority |
Figures as published by the linked sources; table compiled by BusinessCraft.
Related reading
- Armed Conflict by the Numbers: What 2025 Data Signals for Business in 2026
- Russia and China in 2026: Close Partnership, Uneven Economics and the Limits of Alignment
Sources
- U.S. EIA: World Oil Transit Chokepoints (last updated 3 Mar 2026)
- UNCTAD: Maritime trade under pressure – growth set to stall in 2025 (24 Sep 2025)
- Panama Canal Authority: Panama Canal maintains operational and financial strength (8 Oct 2025)
- Suez Canal Authority: EVER GREEN shipping line returns to transit through the Suez Canal (8 Nov 2026)
- Suez Canal Authority: ONE returns to the Suez Canal (15 Nov 2026)