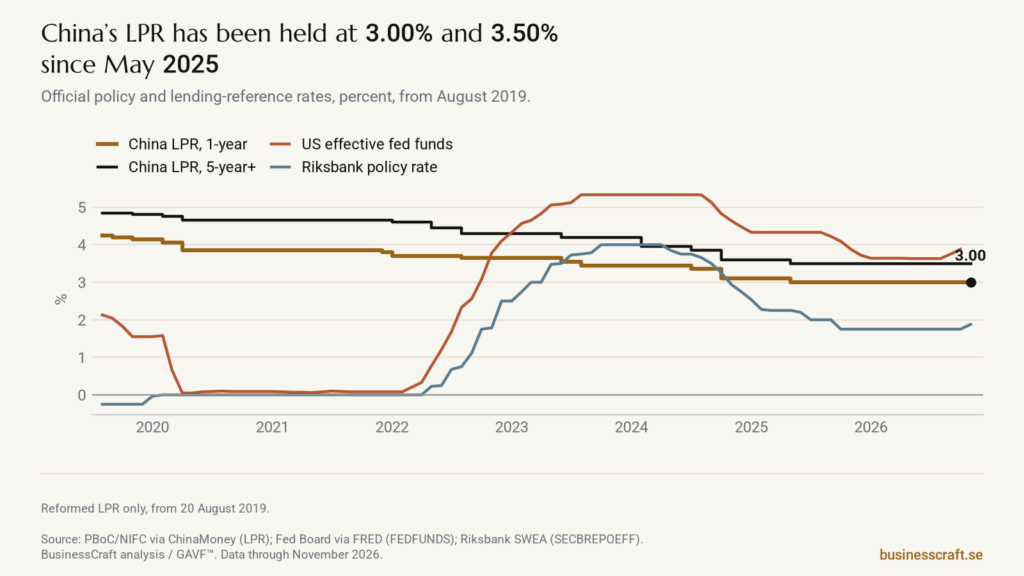
On 20 October 2026 the National Interbank Funding Center, authorised by the People’s Bank of China, left the Loan Prime Rate at 3.00% for one year and 3.50% for five years and over — the same two prints as on 20 May 2025, when both tenors were last cut. On 20 November 2026 the National Interbank Funding Center, authorised by the People’s Bank of China, left both tenors unchanged at 3.00% and 3.50%. Gold is used here as the GAVF™ measuring stick, not as a signal.
Three official rates, one stick
The reformed LPR exists only from 20 August 2019. That first print was 4.25% and 4.85%. The subsequent cuts, then the hold, sit beside a different path in the United States and Sweden (Chart 1). The effective federal funds rate averaged 3.88% in October. The Riksbank’s policy rate, raised to 2.00% from 11 November, is still below both LPR tenors.
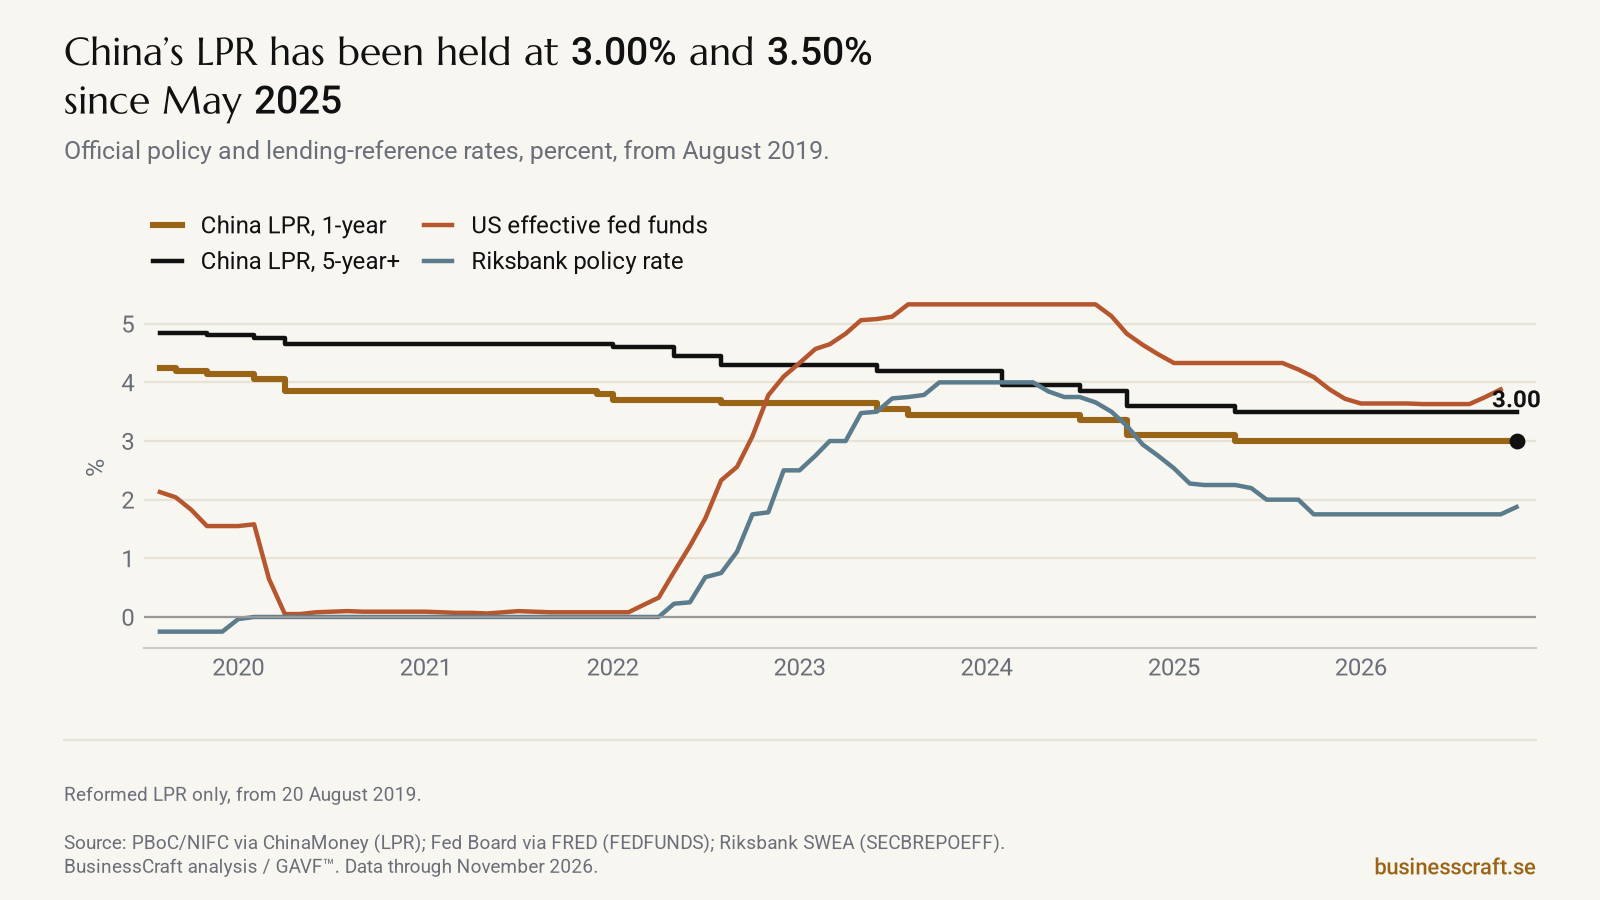
Subtracting consumer-price inflation makes the gap clearer (Chart 2). China’s real one-year LPR was +2.3 percentage points in October (3.00% minus CPI inflation of 0.7%). The US real policy rate was about zero in September (fed funds 3.75% minus CPI 3.74%); there is no October year-on-year US figure, because BLS published no October 2025 CPI. Sweden’s real policy rate was +0.65 points in October (monthly-average policy rate 1.75% minus KPIF 1.1%).
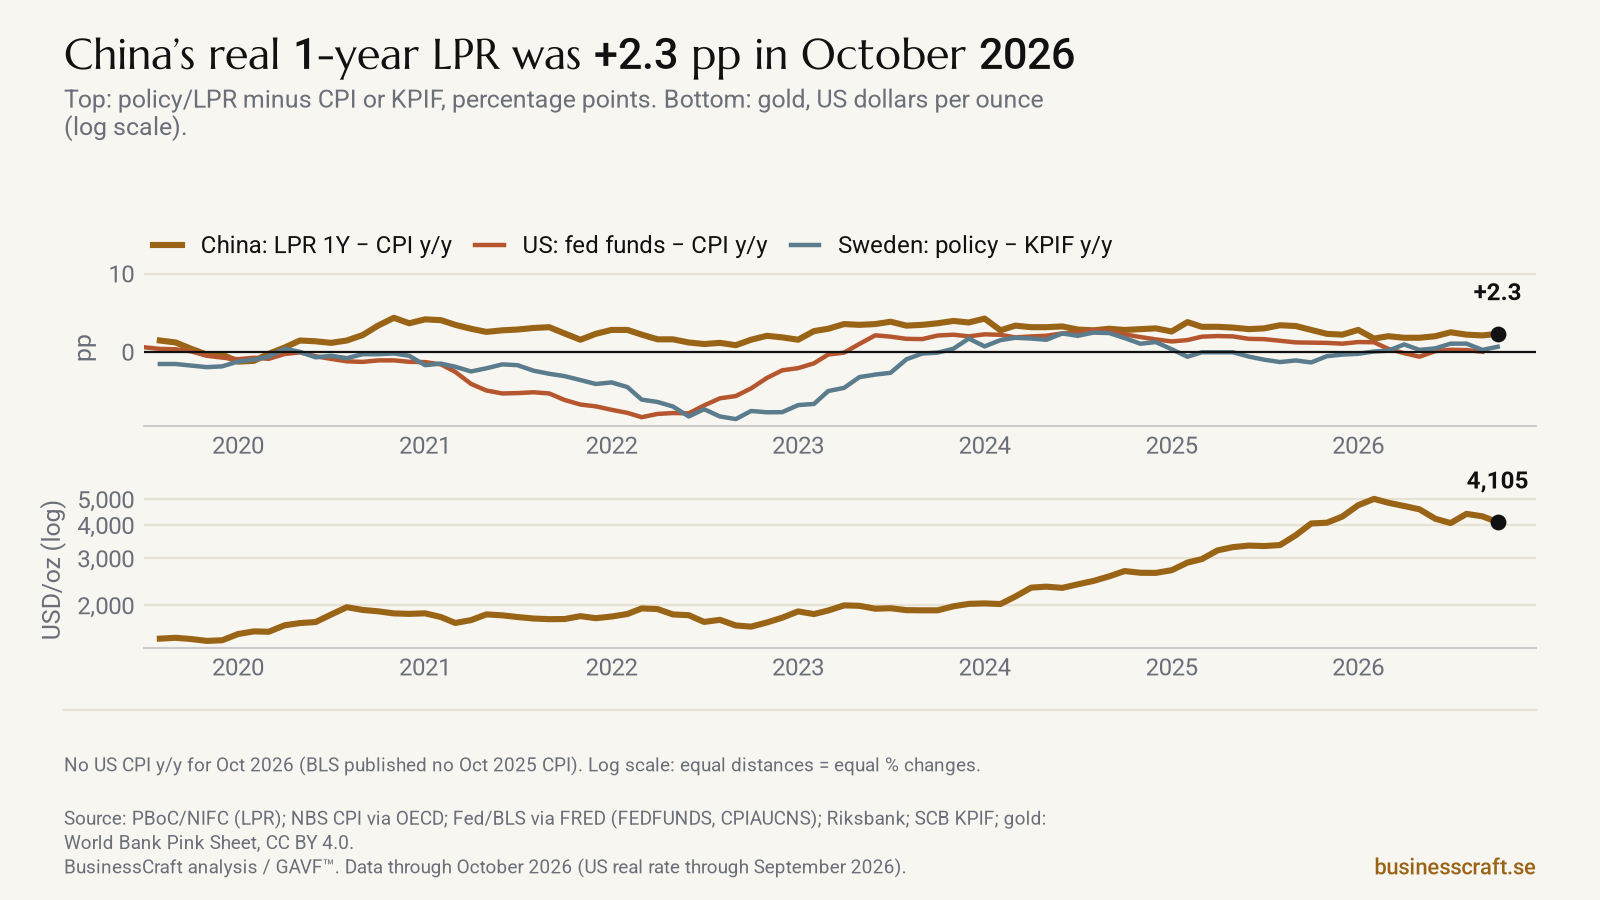
A loan priced at the 5-year LPR shows what that hold has meant in gold. The annual interest on a fixed 1,000,000 yuan principal cost 4.58 ounces in August 2019 and 1.28 ounces in October 2026, about 72% less (Chart 3). That is official-reference arithmetic, not the rate a household pays.
New homes in China, houses in Sweden
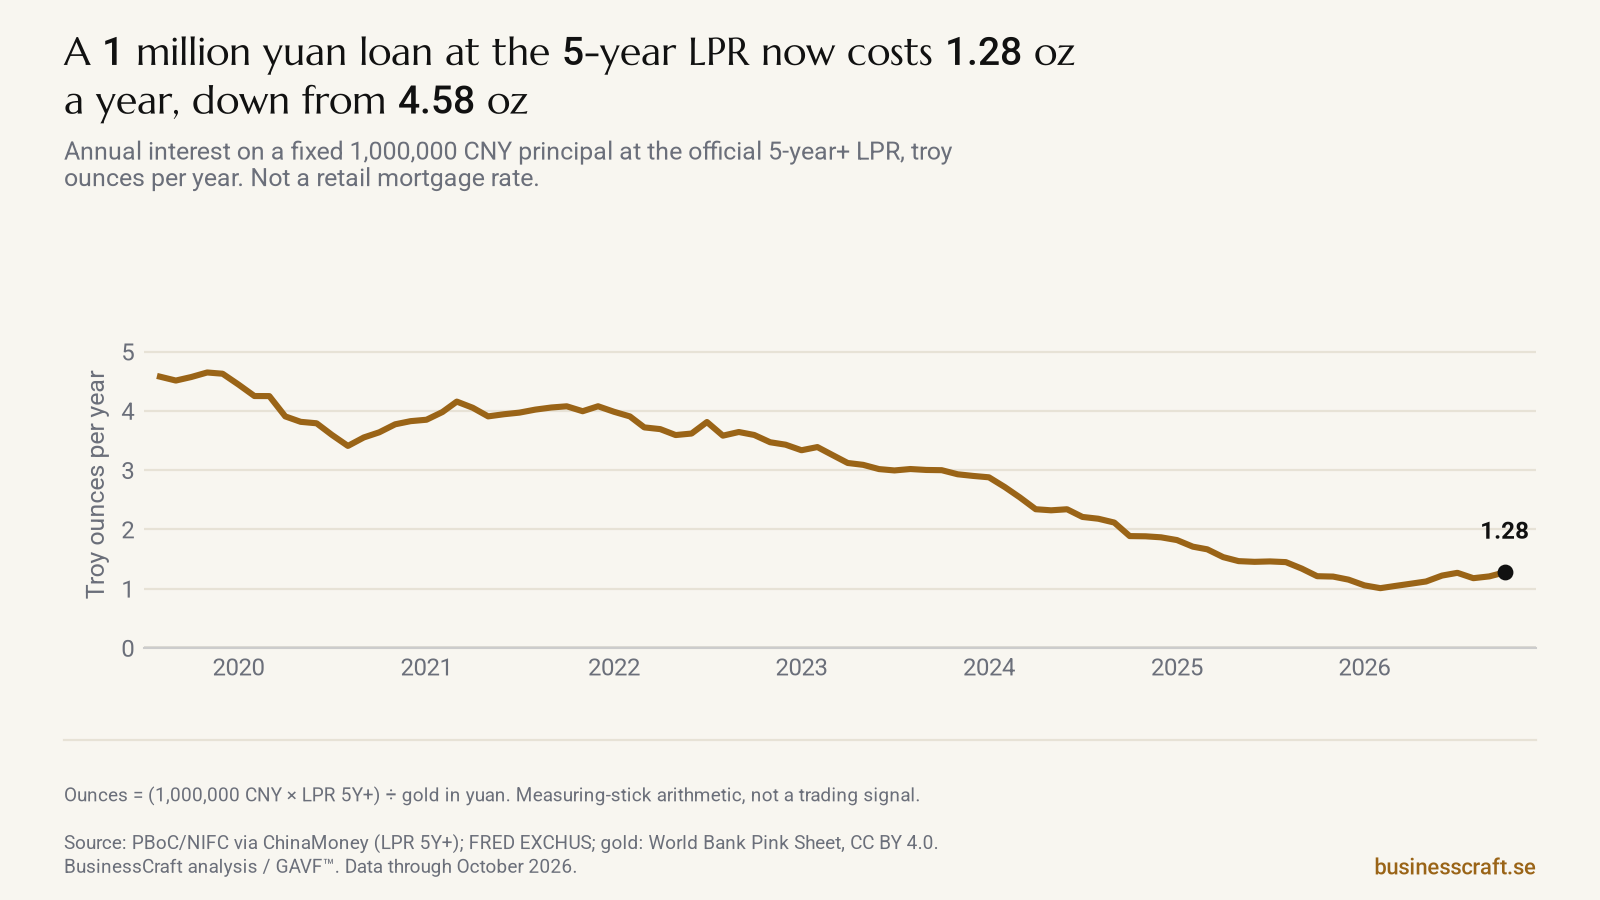
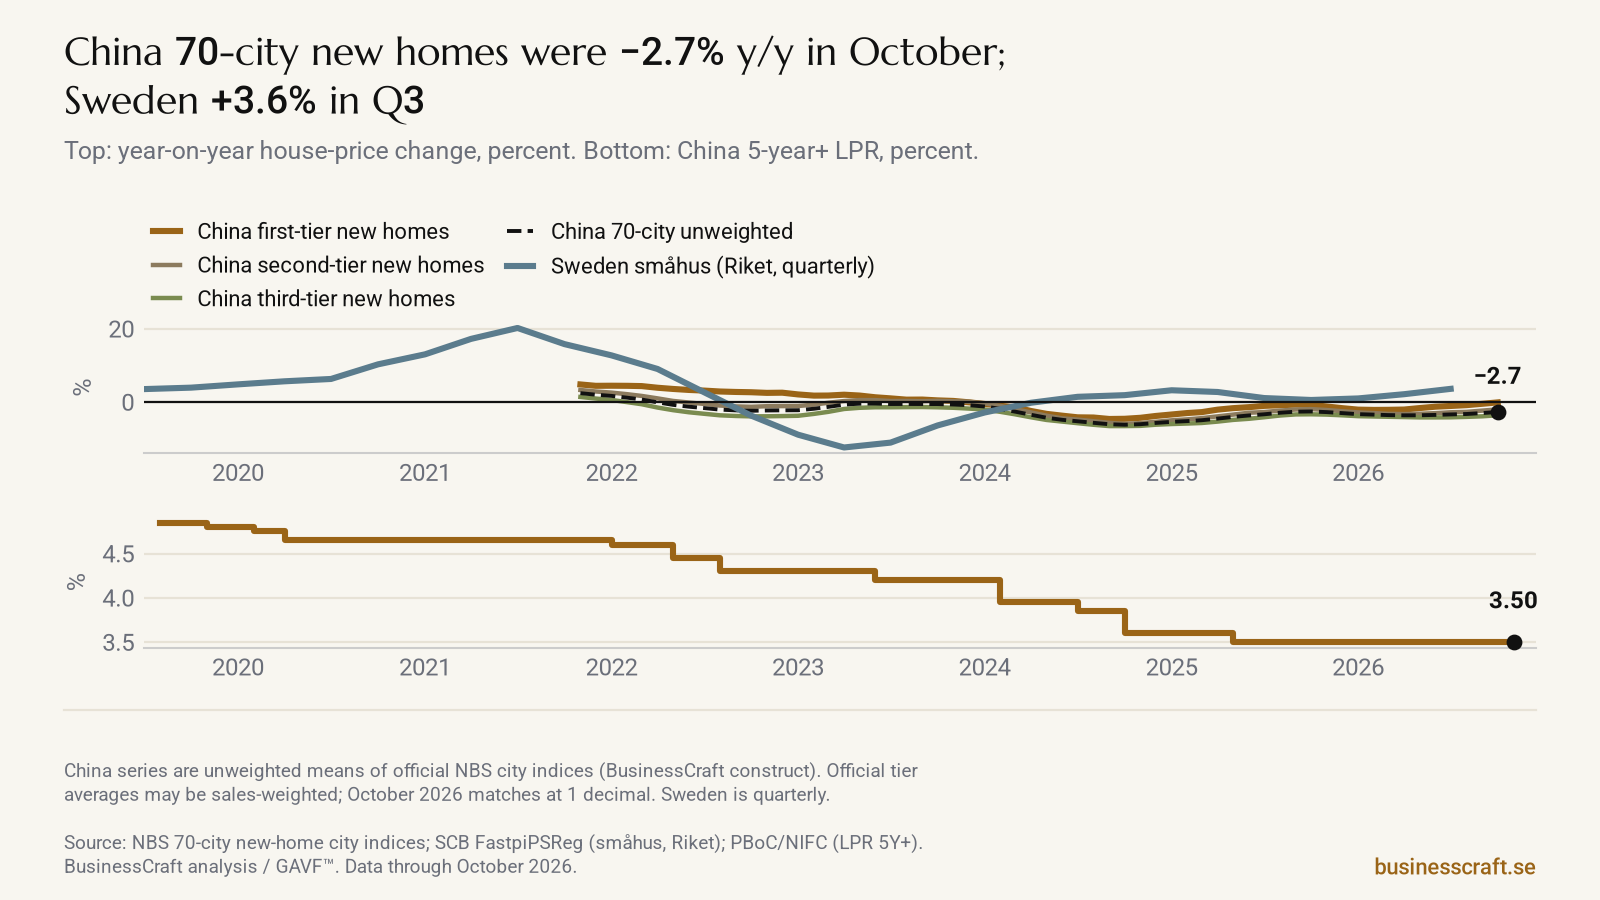
NBS does not publish a single 70-city level index. It publishes official month-on-month and year-on-year indices for each of 70 cities, and official first-, second- and third-tier averages in the statistician’s interpretation. For October those official averages were flat and −0.1% year on year in the first tier, −0.1% and −2.0% in the second, and −0.2% and −3.6% in the third. A BusinessCraft unweighted average of the same official city indices is −2.7% year on year and matches the official tier figures at one decimal place. Swedish small-house prices (SCB FastpiPSReg, nationwide) were +3.6% year on year in the third quarter (Chart 4). The 5-year LPR, the mortgage-reference tenor, has been 3.50% while Chinese new-home prices were still falling on the year.
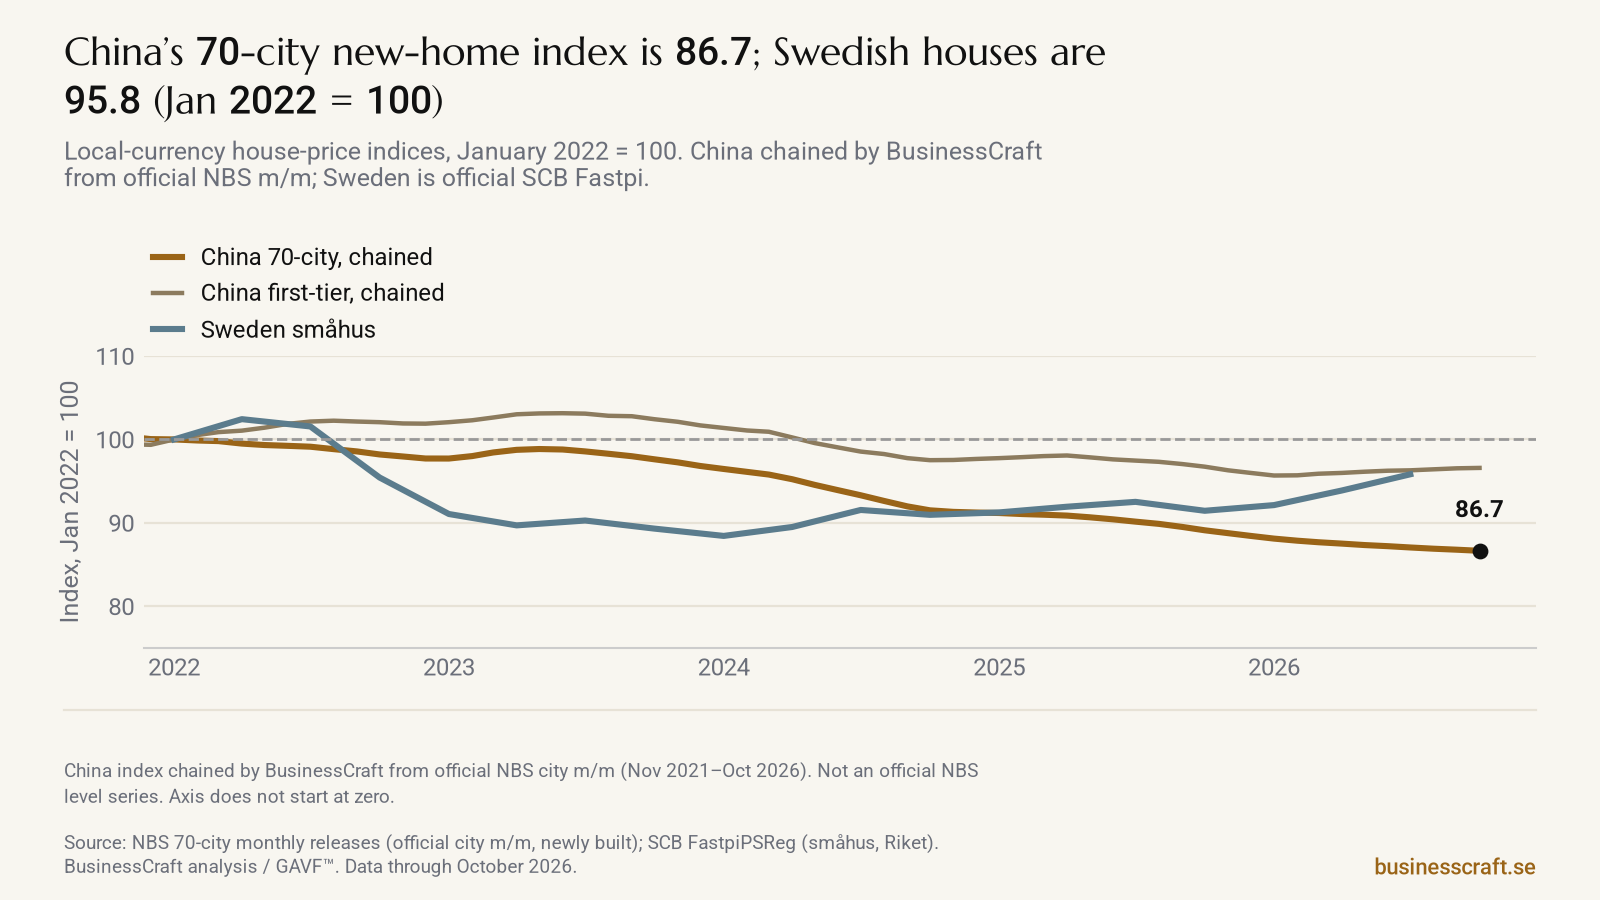
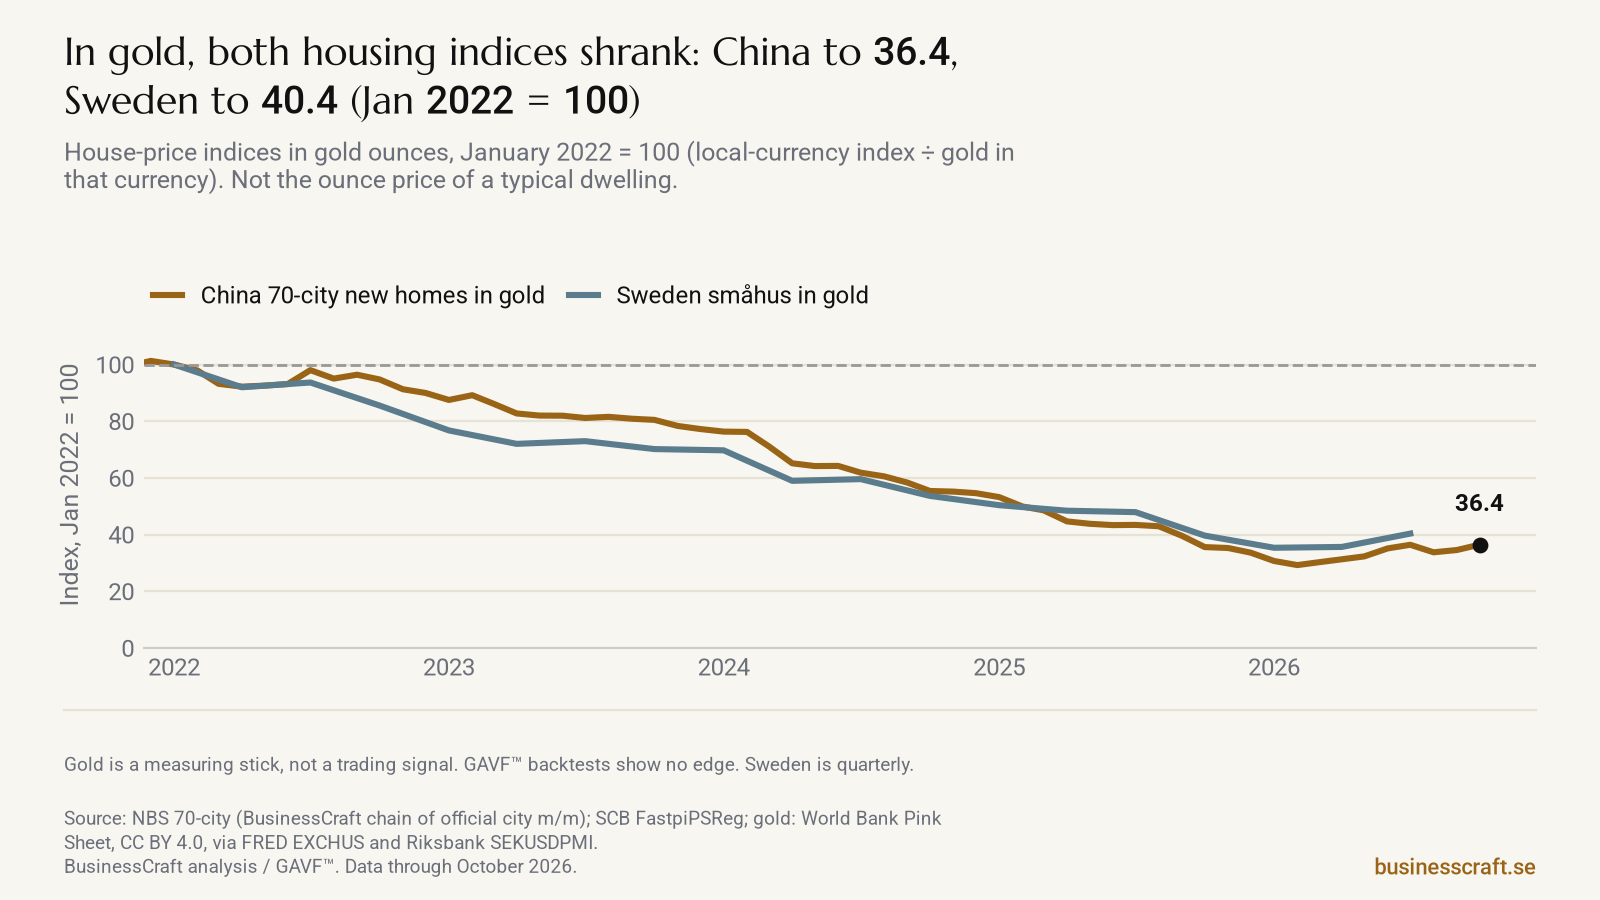
A level comparison is chained by us from the official city month-on-month indices, a complete run from November 2021 to October 2026, rebased to January 2022 = 100. On that base the 70-city index is 86.7 in October and the first-tier index is 96.6; official Swedish Fastpi is 95.8 in the third quarter (Chart 5). Neither market is above its early-2022 level in local currency. In gold the same two indices are 36.4 and 40.4 (Chart 6) — the path of a house-price index in gold, not the ounce price of a typical dwelling.
What we take from this
- China’s lending-reference rate has been cut, then held. The 1-year LPR fell from 4.25% in August 2019 to 3.00%, and the 5-year+ from 4.85% to 3.50%; both have been unchanged since 20 May 2025, including the 20 November 2026 print, below October fed funds (3.88%) and above the Riksbank’s 2.00%.
- The real LPR is clearly positive; the US real policy rate is not. +2.3 points in China in October, about zero in the United States in September.
- The gold cost of LPR interest on a fixed yuan principal has fallen by about three quarters since August 2019, to 1.28 ounces a year on 1,000,000 yuan at the 5-year rate.
- Chinese new-home prices are still down on the year; Swedish house prices are not. Official October tiers range from −0.1% to −3.6%; Sweden was +3.6% in the third quarter. From January 2022 both are lower in local currency and much lower in gold.
Gold is a measuring stick in this pack, not a trading signal. Our own GAVF™ backtests show no edge from gold-measured levels.
Key figures
| Figure | Value | As of |
|---|---|---|
| LPR, 1-year | 3.00% | 20 Nov 2026 |
| LPR, 5-year+ | 3.50% | 20 Nov 2026 (last change 20 May 2025) |
| Effective fed funds | 3.88% | Oct 2026 |
| Riksbank policy rate | 2.00% | in force 19 Nov 2026 (from 11 Nov) |
| Real 1-year LPR | +2.3 pp | Oct 2026 |
| US real policy rate | +0.01 pp | Sep 2026 |
| Sweden real policy rate | +0.65 pp | Oct 2026 |
| Gold, USD/oz | 4,105 | Oct 2026 |
| Interest on 1,000,000 CNY at 5-year+ LPR | 4.58 oz/year → 1.28 oz/year | Aug 2019 → Oct 2026 |
| Official NBS new-home y/y (first / second / third tier) | −0.1% / −2.0% / −3.6% | Oct 2026 |
| China 70-city new-home y/y, unweighted | −2.73% | Oct 2026 |
| Swedish Fastpi y/y (småhus, Riket) | +3.6% | 2026 Q3 |
| House-price level, Jan 2022 = 100 | China 70-city 86.7; first-tier 96.6; Sweden 95.8 | Oct 2026 / Q3 2026 |
| The same indices in gold, Jan 2022 = 100 | China 36.4; Sweden 40.4 | Oct 2026 / Q3 2026 |
Sources
- LPR: PBoC / NIFC via ChinaMoney, reformed series from 20 August 2019 only. The 20 November 2026 print (1-year 3.00%, 5-year+ 3.50%, unchanged) was confirmed against the official PBoC Chinese announcement of 20 November 2026. The PBoC English announcement index had not yet listed that print when the pack was rebuilt on 20 November 2026.
- Fed funds and US CPI: Federal Reserve Board and BLS via FRED. There is no US CPI year-on-year figure for October 2026 (BLS published no October 2025 CPI).
- China CPI: NBS via OECD SDMX (October +0.7%, matching the NBS print).
- Riksbank policy rate and USD/SEK: Riksbank SWEA API.
- Swedish inflation and house prices: SCB KPIF (October 2026) and FastpiPSReg (småhus, Riket, quarterly to Q3 2026).
- China 70-city new homes: official NBS monthly city tables, November 2021–October 2026. The level index is chained by BusinessCraft from official month-on-month indices and is not an official NBS level series. The China and Sweden housing series are not like-for-like dwellings.
- Gold: World Bank Commodity Price Data (The Pink Sheet), CC BY 4.0; yuan and kronor conversions with FRED EXCHUS and Riksbank USD/SEK monthly averages.
Educational analysis, not personal investment advice.